Archive

Articles taggués ‘monitoring’

20 Linux System Monitoring Tools Every SysAdmin Should Know

21/02/2024 Comments off

monitoring toolsNeed to monitor Linux server performance? Try these built-in command and a few add-on tools. Most Linux distributions are equipped with tons of monitoring. These tools provide metrics which can be used to get information about system activities. You can use these tools to find the possible causes of a performance problem. The commands discussed below are some of the most basic commands when it comes to system analysis and debugging server issues such as:

  1. Finding out bottlenecks.
  2. Disk (storage) bottlenecks.
  3. CPU and memory bottlenecks.
  4. Network bottlenecks.

#1: top – Process Activity Command

The top program provides a dynamic real-time view of a running system i.e. actual process activity. By default, it displays the most CPU-intensive tasks running on the server and updates the list every five seconds.
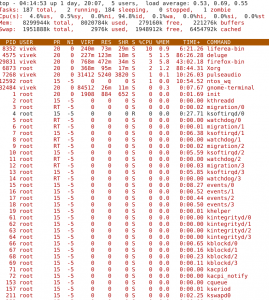
top-output-269x300Commonly Used Hot Keys

The top command provides several useful hot keys:

Hot KeyUsage
tDisplays summary information off and on.
mDisplays memory information off and on.
ASorts the display by top consumers of various system resources. Useful for quick identification of performance-hungry tasks on a system.
fEnters an interactive configuration screen for top. Helpful for setting up top for a specific task.
oEnables you to interactively select the ordering within top.
rIssues renice command.
kIssues kill command.
zTurn on or off color/mono

Lire la suite…

MySQL – Monitorer le port 3306

04/02/2024 Comments off

Pour faire le monitoring du port 3306 sous Linux il suffit d’utiliser la commande :

tcpdump  -i eth0 -nN -vvv -xX  -s 1500  port 3306

Où s représente la longueur du paquet.

Find all active IP addresses in a network

17/01/2024 Comments off

Today I found myself reconfiguring a wireless access point I hadn’t used in a very long time. I no longer have the manual (so I could reset it to factory defaults) nor do I remember what the obscure IP address I configured it with was. Luckily I do know what network it’s setup for ( 192.168.1.x ) but I don’t want to have to try to connect to all 254 IP addresses (192.168.1.1 through 192.168.1.254) as that would take quite some time.

So what I’m going to do is use Nmap a swiss army knife for network operators and system admins. What we’re going to do is use Nmap to scan the entire network and tell us which IP addresses are active. This will allow us to drastically reduce the number of IP addresses we have to try.

There are Nmap versions for all three major OS’s *nix, OS X and Windows. I’ll be showing you the syntax for the *nix/OS X version.

nmap -sP 192.168.1.0/24

replace 192.168.1.0/24 with whatever network it is you’re trying to scan.
The /24 is the netmask of the network in CDIR notation. If you need a cheat sheet you can find one here

Once you press return (or enter) Nmap will start to work pinging each and every IP address on your network and noting which ones respond and which don’t. (Note that if your device has a firewall that discards ping requests it will appear to be down to this scan)

You’ll quickly get an output similar to the following

Starting Nmap 4.50 ( http://insecure.org ) at 2008-08-19 10:15 PDT
HOST 192.168.1.25 appears to be up.
MAC Address: 0:0F:1F:4C:0B:E6 (WW Pcba Test)
Nmap finished: 256 IP addresses (3 hosts up) scanned in 5.711 seconds

Monitor Network Connections in Mac OS X for Free with Private Eye

11/01/2024 Comments off

Source: OSXdaily

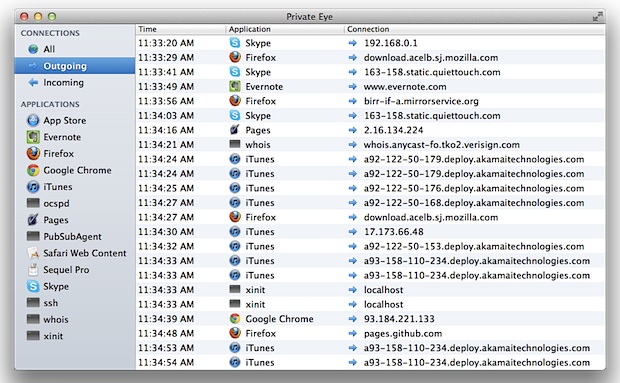
Private Eye is a free real-time network monitor app for Mac OS X that is extremely easy to use. Upon launching the app, you’ll start to see all open network connections by application and process, and you can then filter connections by app, monitor all open connections, or watch only incoming or outgoing transfer.

private-eye-network-connection-monitor-mac

Connections are reported by application, the time of the connection, and arguably the most useful, the IP address that is being connected to by the app, making it easy to see socket and routing data, letting you know exactly what app is communicating with what server or IP address, for both local and broader internet networks. If you have any interest in networking, privacy, security, or you just want to keep an eye on what apps are connecting to the internet and to where, you should download this app, but it’s also an amazingly useful tool for troubleshooting network problems and figuring out what is using the network.


Download and install Private Eye by putting it into your /Applications/ folder, then open PrivateEye to get started. The list of open network connections is easy to read, you’ll see a time stamp of the connection, the application name, and where the connection is going to by IP (or coming from, as determined by the arrow pointing left for in, or right for out).

private-eye-connections

Using the left side menu you can quickly break down connections to see them all, only show incoming transfers, outgoing connections, or display connections by specific application only. Apps are easy to identify in this list, as are daemons running in the background (like PubSubAgent), and command line processes belonging to the user are also visible (ssh, for example).

This is a simple yet powerful tool without the complexity or the learning curves related to compiling and using the command line tools lsof, watch, open_ports, or wireshark, and is therefore highly recommended for anyone who is interested in seeing this kind of information, whether it’s out of general curiosity, or to help troubleshoot and diagnose specific network activities.

MOTDStat – Message Of The Day – System Status

05/01/2024 Comments off

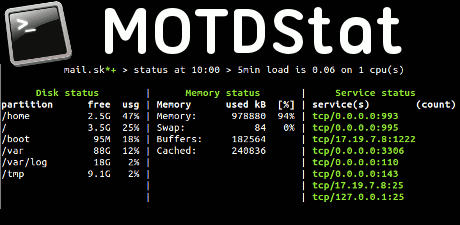
MOTDstatVoici un petit outil qui pourrait se révéler bien pratique dans votre vie de SysAdmin GNU/Linuxien icon wink MOTDStat Message Of The Day System Status

Il s’agit de MOTDStat qui via MOTD va vous permettre d’afficher le statut du serveur sur lequel vous vous connectez.

Cela va vous permettre de savoir en un coup d’œil si il y a un problème quelconque sur le serveur.

MOTDStat va générer dynamiquement le fichier /etc/motd avec les informations sur le systèmes et l’utilisation des ressources.

Les informations sont mises à jour via une tâche périodique en crontab. Le message d’origine est stocké dans /etc/motd.orig

Vous pouvez également configurer une adresse de notification, au cas où vous n’auriez pas un service de supervision qui l’aurait déjà fait, selon des limites prédéfinies :

  • Charge CPU
  • Espace disque
  • Si des process spécifiques ne tourne pas
  • Si des services réseaux sont indisponibles
  • Si NTP n’est pas synchronisé avec sa référence
  • Trop de mail en queue

Afin de permettre l’affichage de MOTDStat lorsque vous vous connectez en ssh il faut mettre à jour la configuration du serveur ssh (/etc/ssh/sshd_config) et positionner à « yes » le paramètre PrintMotd, puis redémarrer le service sshd.

PrintMotd yes

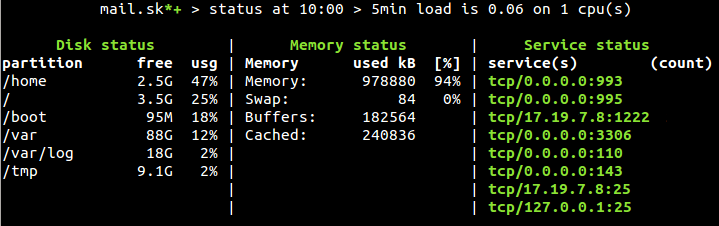
Le rapport MoTDStat est organisé en 3 colonnes :

  • 1ère colonne : Informations sur les partitions
  • 2ème colonne : information sur l’utilisation de la mémoire et du swap
  • 3ème colonne : les process et services supervisés

MOTDstat1

Il est possible de configurer via le fichier /etc/motdstat/netservice d’indiquer un nom de service, ce qui rendra l’affichage plus parlant, par exemple :

tcp         127.0.0.1:80        httpd

Pour définir la liste des process à surveiller, il suffit de les préciser dans /etc/motdstat/process

Bref, un petit outils qui peut être sympa lorsque l’on a plusieurs dizaines, centaines, milliers de serveurs icon wink MOTDStat Message Of The Day System Status


Liens utiles :

Site Officiel de MOTDStat

Page de MOTDStat sur FreeCode

Categories: Système Tags: