Archive

Articles taggués ‘administration’

What are useful CLI tools for Linux system admins ?

22/09/2026 Aucun commentaire

System administrators (sysadmins) are responsible for day-to-day operations of production systems and services. One of the critical roles of sysadmins is to ensure that operational services are available round the clock. For that, they have to carefully plan backup policies, disaster management strategies, scheduled maintenance, security audits, etc. Like every other discipline, sysadmins have their tools of trade. Utilizing proper tools in the right case at the right time can help maintain the health of operating systems with minimal service interruptions and maximum uptime.

14853747084_e14cf18e8f_z

This article will present some of the most popular and useful CLI tools recommended for sysadmins in their day to day activities. If you would like to recommend any useful tool which is not listed here, don’t forget to share it in the comment section.

Network Tools

1. ping: Check end-to-end connectivity (RTT delay, jitter, packet loss) of a remote host with ICMP echo/reply. Useful to check system status and reachability.

2. hping: Network scanning and testing tool that can generate ICMP/TCP/UDP ping packets. Often used for advanced port scanning, firewall testing, manual path MTU discovery and fragmentation testing.

3. traceroute: Discover a layer-3 forwarding path from a local host to a remote destination host with TTL-limited ICMP/UDP/TCP probe packets. Useful to troubleshoot network reachability and routing problems.

4. mtr: A variation of traceroute which characterizes per-hop packet loss/jitter with running statistics. Useful to characterize routing path delays.

5. netcat/socat: A swiss army knife of TCP/IP networking, allowing to read/write byte streams over TCP/UDP. Useful to troubleshoot firewall policies and service availability.

6. dig: DNS troubleshooting tool that can generate forward queries, reverse queries, find authoritative name servers, check CNAME, MX and other DNS records. Can be instructed to query a specific DNS server of your choosing.

7. nslookup: Another DNS checking/troubleshooting tool. Works with all DNS queries and records. Can query a particular DNS server.

8. dnsyo: A DNS testing tool which checks DNS propagation by performing DNS lookup from over a number of open resolvers located across 1,500 different networks around the world.

9. lsof: Show information about files (e.g., regular files, pipes or sockets) which are opened by processes. Useful to monitor processes or users in terms of their open network connections or opened files.

10. iftop: A ncurses-based TUI utility that can be used to monitor in real time bandwidth utilization and network connections for individual network interfaces. Useful to keep track of bandwidth hogging applications, users, destinations and ports.

11. netstat: A network statistics utility that can show status information and statistics about open network connections (TCP/UDP ports, IP addresses), routing tables, TX/RX traffic and protocols. Useful for network related diagnosis and performance tuning.

12. tcpdump: A popular packet sniffer tool based on libpcap packet capture library. Can define packet capturing filters in Berkeley Packet Filters format.

13. tshark: Another CLI packet sniffer software with full compatibility with its GUI counterpart, Wireshark. Supports 1,000 protocols and the list is growing. Useful to troubleshoot, analyze and store information on live packets.

14. ip: A versatile CLI networking tool which is part of iproute2 package. Used to check and modifying routing tables, network device state, and IP tunneling settings. Useful to view routing tables, add/remove static routes, configure network interfaces, and otherwise troubleshoot routing issues.

15. ifup/ifdown: Used to bring up or shut down a particular network interface. Often a preferred alternative to restarting the entire network service.

16. autossh: A program which creates an SSH session and automatically restarts the session should it disconnect. Often useful to create a persistent reverse SSH tunnel across restrictive corporate networks.

17. iperf: A network testing tool which measures maximum bi-directional throughput between a pair of hosts by injecting customizable TCP/UDP data streams in between.

18. elinks/lynx: text-based web browsers for CLI-based server environment.
Lire la suite…

How to analyze and view Apache web server logs interactively on Linux

01/07/2024 Comments off

analyze apache logsWhether you are in the web hosting business, or run a few web sites on a VPS yourself, chances are you want to display visitor statistics such as top visitors, requested files (dynamic or static), used bandwidth, client browsers, and referring sites, and so forth.

GoAccess is a command-line log analyzer and interactive viewer for Apache or Nginx web server. With this tool, you will not only be able to browse the data mentioned earlier, but also parse the web server logs to dig for further data as well – and all of this within a terminal window in real time. Since as of today most web servers use either a Debian derivative or a Red Hat based distribution as the underlying operating system, I will show you how to install and use GoAccess in Debian and CentOS.

Installing GoAccess on Linux

In Debian, Ubuntu and derivatives, run the following command to install GoAccess:

# aptitude install goaccess

In CentOS, you’ll need to enable the EPEL repository and then:

# yum install goaccess

In Fedora, simply use yum command:

# yum install goaccess

If you want to install GoAccess from the source to enable further options (such as GeoIP location), install required dependencies for your operating system, and then follow these steps:

# wget http://tar.goaccess.io/goaccess-0.8.5.tar.gz
# tar -xzvf goaccess-0.8.5.tar.gz
# cd goaccess-0.8.5/
# ./configure --enable-geoip
# make
# make install

That will install version 0.8.5, but you can always verify what is the latest version in the Downloads page of the project’s web site.

Since GoAccess does not require any further configurations, once it’s installed you are ready to go.

Running GoAccess

To start using GoAccess, just run it against your Apache access log.

For Debian and derivatives:

# goaccess -f /var/log/apache2/access.log

For Red Hat based distros:

# goaccess -f /var/log/httpd/access_log

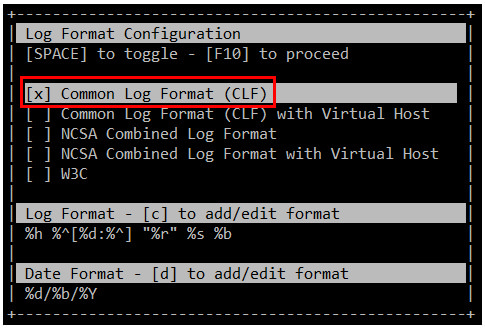
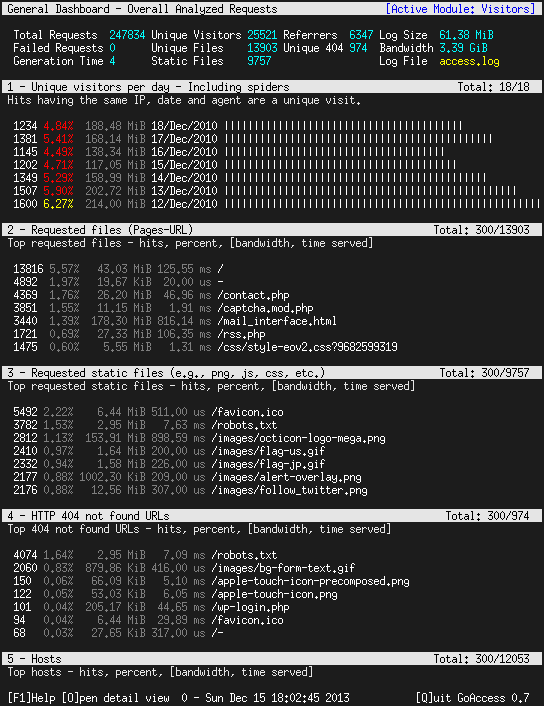
When you first launch GoAccess, you will be presented with the following screen to choose the date and log format. As explained, you can toggle between options using the spacebar and proceed with F10. As for the date and log formats, you may want to refer to the Apache documentation if you need to refresh your memory.

In this case, Choose Common Log Format (CLF):

15868350373_30c16d7c30

and then press F10. You will be presented with the statistics screen. For the sake of brevity, only the header, which shows the summary of the log file, is shown in the next image:

16486742901_7a35b5df69_b

Lire la suite…

How to measure packets per second or throughput on high speed network interface

30/06/2024 Comments off

throughput networkThere are many traffic monitoring tools available on Linux, which can monitor/classify network traffic, and report real-time traffic statistics in fancy user interfaces. Most of these tools (e.g., ntopng, iftop) are powered by libpcap, which is a packet capture library used to monitor network traffic in user space. Despite their versatility, however, libpcap-based network monitoring tools cannot scale to handle traffic on multi Gigabit rate network interfaces, due to the overhead associated with user-space packet capture.

In this tutorial, I will present simple shell scripts that can monitor network traffic on per-interface basis, without relying on slow libpcap library. These scripts are fast enough to support multi Gigabit rates, but only suitable if you are interested in « aggregate » network statistics on per interface basis.

The secret for the scripts lies in sysfs virtual filesystem which is used by the kernel to export device- or driver-related information to user space. Network interface related statistics are exported via /sys/class/net/<ethX>/statistics.

For example, the statistics on eth0 interface are found in these files:

  • /sys/class/net/eth0/statistics/rx_packets: number of packets received
  • /sys/class/net/eth0/statistics/tx_packets: number of packets transmitted
  • /sys/class/net/eth0/statistics/rx_bytes: number of bytes received
  • /sys/class/net/eth0/statistics/tx_bytes: number of bytes transmitted
  • /sys/class/net/eth0/statistics/rx_dropped: number of packets dropped while received
  • /sys/class/net/eth0/statistics/tx_dropped: number of packets dropped while transmitted

The numbers stored in the files are automatically refreshed in real-time by the kernel. Therefore, you can write scripts that calculate traffic statistics based on these files.

The following are two such scripts (thanks to joemiller). The first script counts the number of packets per second, received (RX) or sent (TX) on an interface, while the latter scripts measures the network bandwidth of incoming (RX) and outgoing (TX) traffic on an interface. For these scripts to work, you do not need to install anything.

Measure Packets per Second on an Interface

#!/bin/bash
INTERVAL="1"  # update interval in seconds
if [ -z "$1" ]; then
        echo
        echo usage: $0 [network-interface]
        echo
        echo e.g. $0 eth0
        echo
        echo shows packets-per-second
        exit
fi

IF=$1

while true
do
        R1=`cat /sys/class/net/$1/statistics/rx_packets`
        T1=`cat /sys/class/net/$1/statistics/tx_packets`
        sleep $INTERVAL
        R2=`cat /sys/class/net/$1/statistics/rx_packets`
        T2=`cat /sys/class/net/$1/statistics/tx_packets`
        TXPPS=`expr $T2 - $T1`
        RXPPS=`expr $R2 - $R1`
        echo "TX $1: $TXPPS pkts/s RX $1: $RXPPS pkts/s"
done
 

Measure Network Bandwidth on an Interface

#!/bin/bash
 
INTERVAL="1" # update interval in seconds
 
if [ -z "$1" ]; then
 echo
 echo usage: $0 [network-interface]
 echo
 echo e.g. $0 eth0
 echo
 exit
fi
 
IF=$1
 
while true
do
 R1=`cat /sys/class/net/$1/statistics/rx_bytes`
 T1=`cat /sys/class/net/$1/statistics/tx_bytes`
 sleep $INTERVAL
 R2=`cat /sys/class/net/$1/statistics/rx_bytes`
 T2=`cat /sys/class/net/$1/statistics/tx_bytes`
 TBPS=`expr $T2 - $T1`
 RBPS=`expr $R2 - $R1`
 TKBPS=`expr $TBPS / 1024`
 RKBPS=`expr $RBPS / 1024`
 echo "TX $1: $TKBPS kB/s RX $1: $RKBPS kB/s"
done
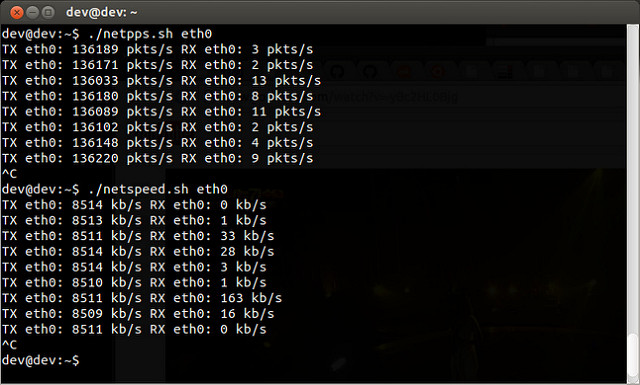
The following screenshot shows the above two scripts in action.

10700906313_cfa3cd1ed7_z

Source: Xmodulo 

How to configure SNMPv3 in Ubuntu, CentOS and Cisco

29/06/2024 Comments off

snmpv3 ubuntuSimple Network Management Protocol (SNMP) is a widely used protocol for gathering information about what is going on within a device. For example, CPU and RAM usage, load on a server, traffic status in a network interface, and many other interesting properties of a device can be queried using SNMP.

Currently, three versions of SNMP are available: v1, v2c and v3. SNMP v1 and v2c can be easily configured, which has been discussed in a previous article. SNMPv3 adds some additional features, including authentication and encryption schemes (e.g., MD5, SHA, AES and DES). This makes SNMPv3 more secure and advisable while you run SNMP queries over the Internet.

SNMPv3 configuration is a bit different compared to SNMP v1 or v2c. The following sections explain in detail how the configuration is done.

Configure SNMPv3 on Ubuntu or Debian

The net-snmp-config tool is used for configuration. The following example creates a read-only SNMPv3 user named ‘snmpv3user‘ with password ‘snmpv3pass‘. Default authentication method MD5 and default encryption DES are used. These values can be customized as well.

root@server:~# apt-get install snmp snmpd
 root@server:~# service snmpd stop
 root@server:~# net-snmp-config --create-snmpv3-user -ro -A snmpv3pass snmpv3user
## OUTPUT ##
adding the following line to /var/lib/snmp/snmpd.conf:
   createUser snmpv3user MD5 "snmpv3pass" DES
adding the following line to /usr/share/snmp/snmpd.conf:
   rouser snmpv3user

root@server:~# service snmpd start

Lire la suite…

Categories: Réseau Tags: ,

What are good open-source log monitoring tools on Linux ?

26/06/2024 Comments off


In an operating system, logs are all about keeping track of events, be it critical system errors, resource usage warnings, transaction history, application status, or user activities. These logs, which are stored as (text or binary) files in the system, are useful for system auditing, debugging and maintenance. However, with so many different system entities generating log files, and even at growing rate, the challenge as a system admin is to how to « consume » these log files effectively.

That’s when log monitoring tools come into the picture, which streamline the often laborious process of collecting, parsing and analyzing log files, as well as alerting system admins for any interesting events. These tools are designed from ground up focused on log monitoring, so they offer many attractive features, such as scalable log aggregation and filtering, human-readable display, event correlation, visual or email notification, flexible log retention policy, and so on.

In this post, I am going to introduce a list of popular open-source log monitoring software for Linux, ranging from simple log file viewers to full-blown log monitoring frameworks.

Log Aggregation and Filtering

Log monitoring would not be possible without efficient and scalable mechanisms to collect and pre-process log files. Tools in this category focus on shipping, collecting, filtering, indexing and storing log files, so that they can be further analyzed and visualized in subsequent monitoring pipelines.

1. rsyslog: an open-source log collector server which can filter and consolidate log data (based on syslog protocol) from different hosts and devices in the network. rsyslog can be configured as a server or a client, where the former plays the role of a log collector and the latter runs as a log sender.

2. syslog-ng: another open-source implementation of the syslog protocol with more advanced and user-friendly features such as content-based filtering, easier-to-understand config format, and real-time event correlation.

3. systemd journal: systemd journal can be configured for remote journal logging, where locally logged events are forwarded to a remote server over HTTP. In this setup, systemd-journal-upload on a client host serializes and forwards journal messages to systemd-journal-remote running on a remote collector server.

4. logstash: an open-source tool that collects, parses, and stores log files for offline search and analysis. logstash can run in various pipelines due to many plugins supporting different input/output interfaces, decoding/encoding, and filtering rules. Input plugins allows logstash to gather log files from different sources and protocols (e.g., files, S3, RabbitMQ, syslog, collectd, TCP/UDP sockets). Filter/codec plugins are used to parse, convert, modify and add metadata to log files. Output plugins pass processed log files to various target storages (e.g., file, Google cloud storage, Nagios, S3, Zabbix).

5. collectd: a daemon service which gathers various system-level statistics, and stores them for historical analysis or real-time graphing. Similar to logstash, collectd is an extensible architecture, where you can enable various input/output plugins to change its collection behaviors. For log collection, collectd can leverage LogFile and Network plugins to aggregate remote log files.

6. Logster: an open-source utility for parsing log files for any interesting data, and aggregating extracted data into metrics for subsequent reporting and graphing pipelines.

7. Fluentd: a unified log aggregation layer which allows in-stream processing for a variety of streaming data and log files. It comes with a huge plugin ecosystem with more than 300 plugins to support various input sources and output interfaces.

8. Nxlog: a unified log collector and forwarder which supports a variety of log sources, formats and protocols. Advanced features include multi-threaded log collection and processing, message buffering and prioritization, built-in log rotation, and TLS/SSL transport.

9. Scribe:: a scalable log collector server developed by Facebook. Scribe can aggregate log data which is streamed in real time from a large number of clients. It uses Apache Thrift for protocol encoding, so its interface is compatible with pretty much any languages. While a proven solution, Scribe is not something you can deploy quickly as a turnkey. Also, note that Scribe is no longer updated and maintained.

10. Flume: a highly scalable and reliable service to transport and collect large volumes of streaming log data from any clients, and store them in backend storage such as Apache Hadoops’ HDFS.

Lire la suite…