Archive

Articles taggués ‘monitoring’

How to set up web-based network traffic monitoring system on Linux

23/11/2023 Comments off

When you are tasked with monitoring network traffic on the local network, you can consider many different options to do it, depending on the scale/traffic of the local network, monitoring platforms/interface, types of backend database, etc.

ntopng is an open-source (GPLv3) network traffic analyzer which provides a web interface for real-time network traffic monitoring. It runs on multiple platforms including Linux and MacOS X. ntopng comes with a simple RMON-like agent with built-in web server capability, and uses Redis-backed key-value server to store time series statistics. You can install ntopng network traffic analyzer on any designated monitoring server connected to your network, and use a web browser to access real-time traffic reports available on the server.

In this tutorial, I will describe how to set up a web-based network traffic monitoring system on Linux by using ntopng.

Features of ntopng

  • Flow-level, protocol-level real-time analysis of local network traffic.
  • Domain, AS (Autonomous System), VLAN level statistics.
  • Geolocation of IP addresses.
  • Deep packet inspection (DPI) based service discovery (e.g., Google, Facebook).
  • Historical traffic analysis (e.g., hourly, daily, weekly, monthly, yearly).
  • Support for sFlow, NetFlow (v5/v9) and IPFIX through nProbe.
  • Network traffic matrix (who’s talking to who?).
  • IPv6 support.

Install ntopng on Linux

The official website offers binary packages for Ubuntu and CentOS. So if you use either platform, you can install these packages.

If you want to build the latest ntopng from its source, follow the instructions below. (Update: these instructions are valid for ntopng 1.0. For ntopng 1.1 and higher, see the updated instructions).

To build ntopng on Debian, Ubuntu or Linux Mint:

$ sudo apt-get install libpcap-dev libglib2.0-dev libgeoip-dev redis-server wget libxml2-dev
$ tar xzf ntopng-1.0.tar.gz -C ~
$ cd ~/ntopng-1.0/
$ ./configure
$ make geoip
$ make

In the above steps, « make geoip » will automatically download a free version of GeoIP databases with wget from maxmind.com. So make sure that your system is connected to the network.

To build ntopng on Fedora:

$ sudo yum install libpcap-devel glib2-devel GeoIP-devel libxml2-devel libxml2-devel redis wget
$ tar xzf ntopng-1.0.tar.gz -C ~
$ cd ~/ntopng-1.0/
$ ./configure
$ make geoip
$ make

To install ntopng on CentOS or RHEL, first set up EPEL repository, and then follow the same instructions as in Fedora above.

Configure ntopng on Linux

After building ntopng, create a configuration directory for ntopng, and prepare default configuration files as follows. I assume that « 192.168.1.0/24 » is the CIDR address prefix of your local network.

$ sudo mkir /etc/ntopng -p
$ sudo -e /etc/ntopng/ntopng.start
--local-networks "192.168.1.0/24"
--interface 1
$ sudo -e /etc/ntopng/ntopng.conf
-G=/var/run/ntopng.pid

Lire la suite…

How to monitor a Linux server and desktop remotely from web browser

21/11/2023 Comments off

Monitoring Linux server

When it comes to monitoring a Linux server, there are more than enough options to choose from. While there are many production-quality monitoring solutions (e.g., Nagios, Zabbix, Zenoss), boasting of fancy UI, monitoring scalability, comprehensive reporting capabilities, etc., these solutions are probably an overkill for most of us end users. If all you need is to check the basic status (e.g., CPU load, memory usage, active processes, disk usage) of a remote Linux server or desktop, consider linux-dash.

linux-dash is a web-based lightweight monitoring dashboard for Linux machines, which can display, in real-time, various system properties, such as CPU load, RAM usage, disk usage, Internet speed, network connections, RX/TX bandwidth, logged-in users, running processes etc. linux-dash does not come with any backend database for storing long-term statistics. Simply drop in linux-dash app in an existing web server (e.g., Apache, Nginx), and you are good to go. It is a quick and easy way to set up remote monitoring for personal projects.

In this tutorial, I am going to describe how to set up linux-dash in Nginx web server on Linux. Nginx is preferred over Apache web server due to its lightweight engine.

Set up linux-dash on Debian, Ubuntu or Linux Mint

First, install Nginx web server with php-fpm.

$ sudo apt-get install git nginx php5-json php5-fpm php5-curl

Configure Nginx for linux-dash app by creating /etc/nginx/conf.d/linuxdash.conf as follows. In this example, we are going to use port 8080.

$ sudo vi /etc/nginx/conf.d/linuxdash.conf
server {
 server_name $domain_name;
 listen 8080;
 root /var/www;
 index index.html index.php;
 access_log /var/log/nginx/access.log;
 error_log /var/log/nginx/error.log;
 
 location ~* .(?:xml|ogg|mp3|mp4|ogv|svg|svgz|eot|otf|woff|ttf|css|js|jpg|jpeg|gif|png|ico)$ {
 try_files $uri =404;
 expires max;
 access_log off;
 add_header Pragma public;
 add_header Cache-Control "public, must-revalidate, proxy-revalidate";
 }
 
 location /linux-dash {
 index index.html index.php;
 }
 
 # PHP-FPM via sockets
 location ~ .php(/|$) {
 fastcgi_param SCRIPT_FILENAME $document_root$fastcgi_script_name;
 fastcgi_split_path_info ^(. ?.php)(/.*)$;
 fastcgi_pass unix:/var/run/php5-fpm.sock;
 if (!-f $document_root$fastcgi_script_name) {
 return 404;
 }
 try_files $uri $uri/ /index.php?$args;
 include fastcgi_params;
 }
}

Disable the default site configuration.

$ sudo rm /etc/nginx/sites-enabled/default

Configure php-fpm by editing /etc/php5/fpm/pool.d/www.conf. Make sure to edit « user« , « group » and « listen » directives as shown below. You can keep the rest of the configuration unchanged.

$ sudo vi /etc/php5/fpm/pool.d/www.conf

. . .
user = www-data
group = www-data
listen = /var/run/php5-fpm.sock
. . .

Proceed to download and install linux-dash.

$ git clone https://github.com/afaqurk/linux-dash.git
$ sudo cp -r linux-dash/ /var/www/
$ sudo chown -R www-data:www-data /var/www

Restart Nginx web server as well as php5-fpm to finalize installation.

$ sudo service php5-fpm restart
$ sudo service nginx restart

Lire la suite…

How to sniff HTTP traffic from the command line on Linux

20/11/2023 Comments off

sniff HTTP trafficSuppose you want to sniff live HTTP web traffic (i.e., HTTP requests and responses) on the wire for some reason. For example, you may be testing experimental features of a web server. Or you may be debugging a web application or a RESTful service. Or you may be trying to troubleshoot PAC (proxy auto config) or check for any malware files surreptitiously downloaded from a website. Whatever the reason is, there are cases where HTTP traffic sniffing is helpful, for system admins, developers, or even end users.

While packet sniffing tools such as tcpdump are popularly used for live packet dump, you need to set up proper filtering to capture only HTTP traffic, and even then, their raw output typically cannot be interpreted at the HTTP protocol level so easily. Real-time web server log parsers such as ngxtopprovide human-readable real-time web traffic traces, but only applicable with a full access to live web server logs.

What will be nice is to have tcpdump-like sniffing tool, but targeting HTTP traffic only. In fact, httpryis extactly that: HTTP packet sniffing tool. httpry captures live HTTP packets on the wire, and displays their content at the HTTP protocol level in a human-readable format. In this tutorial, let’s see how we can sniff HTTP traffic with httpry.

Install httpry on Linux

On Debian-based systems (Ubuntu or Linux Mint), httpry is not available in base repositories. So build it from the source:

$ sudo apt-get install gcc make git libpcap0.8-dev
$ git clone https://github.com/jbittel/httpry.git
$ cd httpry
$ make
$ sudo make install

On Fedora, CentOS or RHEL, you can install httpry with yum as follows. On CentOS/RHEL, enableEPEL repo before running yum.

$ sudo yum install httpry

If you still want to build httpry from the source on RPM-based systems, you can easily do that by:

$ sudo yum install gcc make git libpcap-devel
$ git clone https://github.com/jbittel/httpry.git
$ cd httpry
$ make
$ sudo make install

Basic Usage of httpry

The basic use case of httpry is as follows.

$ sudo httpry -i <network-interface>

httpry then listens on a specified network interface, and displays captured HTTP requests/responses in real time.

In most cases, however, you will be swamped with the fast scrolling output as packets are coming in and out. So you want to save captured HTTP packets for offline analysis. For that, use either ‘-b’ or ‘-o’ options. The ‘-b’ option allows you to save raw HTTP packets into a binary file as is, which then can be replayed with httpry later. On the other hand, ‘-o’ option saves human-readable output ofhttpry into a text file.

To save raw HTTP packets into a binary file:

$ sudo httpry -i eth0 -b output.dump

To replay saved HTTP packets:

$ httpry -r output.dump

Note that when you read a dump file with ‘-r’ option, you don’t need root privilege.

To save httpry‘s output to a text file:

$ sudo httpry -i eth0 -o output.txt

Advanced Usage of httpry

If you want to monitor only specific HTTP methods (e.g., GET, POST, PUT, HEAD, CONNECT, etc), use ‘-m’ option:

$ sudo httpry -i eth0 -m get,head

If you downloaded httpry‘s source code, you will notice that the source code comes with a collection of Perl scripts which aid in analyzing httpry‘s output. These scripts are found in httpry/scripts/plugins directory. If you want to write a custom parser for httpry‘s output, these scripts can be good examples to start from. Some of their capabilities are:

  • hostnames: Display a list of unique host names with counts.
  • find_proxies: Detect web proxies.
  • search_terms: Find and count search terms entered in search services.
  • content_analysis: Find URIs which contain specific keywords.
  • xml_output: Convert output into XML format.
  • log_summary: Generate a summary of log.
  • db_dump: Dump log file data into a MySQL database.

Before using these scripts, first run httpry with ‘-o’ option for some time. Once you obtained the output file, run the scripts on it at once by using this command:

$ cd httpry/scripts
$ perl parse_log.pl -d ./plugins <httpry-output-file>

You may encounter warnings with several plugins. For example, db_dump plugin may fail if you haven’t set up a MySQL database with DBI interface. If a plugin fails to initialize, it will automatically be disabled. So you can ignore those warnings.

After parse_log.pl is completed, you will see a number of analysis results (*.txt/xml) in httpry/scripts directory. For example, log_summary.txt looks like the following.

To conclude, httpry can be a life saver if you are in a situation where you need to interpret live HTTP packets. That might not be so common for average Linux users, but it never hurts to be prepared. What do you think of this tool?

Source: Xmodulo

Categories: Système Tags: , , ,

Installation et configuration d’Observium sous debian / ubuntu

03/06/2021 Comments off

Source: NooBUNBOX

Observium est un système de supervision de réseaux basé sur PHP / MySQL. Il supporte une large gamme de distributions (Windows, Linux, FreeBS, ESXI, etc.) et de matériels (Cisco, Linksys, Juniper, Dell).

Observium se décline en deux versions :

  • Observium Community Edition : une version gratuite, open-source et mise à jour tous les 6 mois.
  • Observium Profesionnal : une version payante (£150/an) distribuée via svn patchée quotidiennement (bug fixes, mises à jour de sécurité et nouvelles features)

Pour une utilisation non-professionnelle la version Community Edition suffit. Ici nous allons nous intéreser à l’installation et la configuration d’Observium sous debian 7.

Installation d’Observium

Ici nous partons d’une distribution propre, il nous faut donc commencer par installer les dépendances

sudo apt-get install libapache2-mod-php5 php5-cli php5-mysql php5-gd php5-mcrypt php5-json php-pear snmp fping \
mysql-server mysql-client python-mysqldb rrdtool subversion whois mtr-tiny ipmitool graphviz imagemagick

Créez le répertoire ou nous installerons Observium

Téléchargez la dernière version du logiciel et extrayez la

Lire la suite…

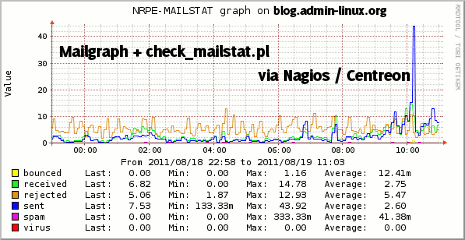
Supervision de postfix via mailgraph avec le plugin check_mailstat.pl via Nagios/Centreon

28/03/2021 Comments off

Source:  l’admin sous GNU/Linux – blog libreCentreon_graph_mailstat_home


Voici une procédure permettant de contrôler l’activité d’un serveur de messagerie postfix via Nagios / Centreon.

Pour cela nous allons utiliser le plugins check_mailstat.pl avec une petite adaptation du script afin de le rendre compatible avec la génération de graphe sous Centreon.

Le plugin check_mailstat.pl va récupérer depuis des données depuis mailgraph qui permet de générer des graphes via RRDTool

Tout d’abord, il faut installer Mailgraph sur l’hôte à superviser, ici une Debian.

Installation de Mailgraph

aptitude install mailgraph

Si l’installation ne vous a pas poser les questions propres au paramétrage, lancer :

dpkg-reconfigure mailgraph

Voici les questions et réponse à fournir :

Mailgraph doit-il être lancé au démarrage ? OUI

Fichier de journalisation à utiliser par mailgraph : /var/log/mail.log (à adapter)

Faut-il compter les courriels entrants comme des courriels sortants ? NON (J’utilise Amavis, donc j’ai choisi cette option, encore une fois à adapter.

Lire la suite…