As a Linux sysadmin it feels great power when monitoring system resources like cpu, memory on the commandline. To peek inside the system is a good habit here atleast, because that’s one way of driving your Linux system safe. Plenty of tools like Htop, Nmon, Collectl, top and iotop etc help you accomplish the task. Today lets try another tool called Glances.
Glances
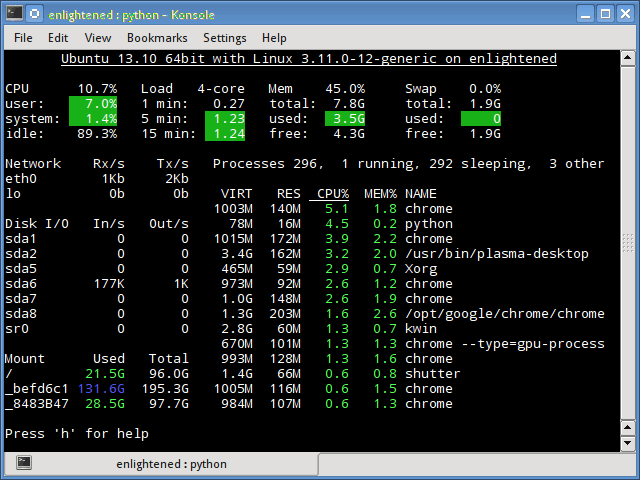
Glances is a tool similar to Nmon that has a very compact display to provide a complete overview of different system resources on just a single screen area. It does not support any complex functionality but just gives a brief overview CPU, Load, Memory, Network rate, Disk IO, file system, process number and details.
As a bonus, glances is actually cross platform, which means you can use it on obsolete OSes like windows :P.
Here’s a quick glimpse of it.

The output is color highlighted. Green indicates optimum levels of usage whereas red indicates that the particular resource is under heavy use.
$ glances -v
Glances version 1.6 with PsUtil 0.6.1
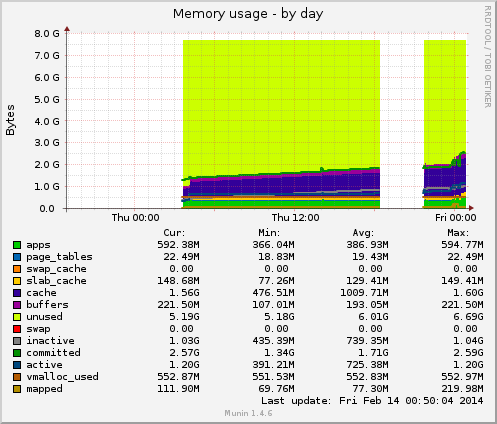
Graphs are added and removed via symlinks in the /etc/munin/plugins/ directory of the node.
To remove a graph you must remove the symlink and restart the node:
rm /etc/munin/plugins/diskstats
service munin-node restart
To add a graph you must add a symlink in the plugins directory to an executable. eg:
ln -s /usr/share/munin/plugins/diskstats /etc/munin/plugins/diskstats
service munin-node restart
When you restart munin-node it runs immediately and any issues with the plugins appears in /var/log/munin/munin-node.log. If all is going well you’ll see a CONNECT logged every cycle; this records the fact that the master connected to collect the latest data.
Process Backgrounded
2014/03/10-15:59:47 Munin::Node::Server (type Net::Server::Fork) starting! pid(32231)
Resolved [*]:4949 to [::]:4949, IPv6
Not including resolved host [0.0.0.0] IPv4 because it will be handled by [::] IPv6
Binding to TCP port 4949 on host :: with IPv6
2014/03/10-16:00:04 CONNECT TCP Peer: "[::ffff:203.28.51.227]:45965" Local: "[::ffff:50.23.111.122]:4949"
2014/03/10-16:05:04 CONNECT TCP Peer: "[::ffff:203.28.51.227]:46109" Local: "[::ffff:50.23.111.122]:4949"
2014/03/10-16:10:04 CONNECT TCP Peer: "[::ffff:203.28.51.227]:46109" Local: "[::ffff:50.23.111.122]:4949"
lsof is the sysadmin/security über-tool. I use it most for getting network connection related information from a system, but that’s just the beginning for this powerful and too-little-known application. The tool is aptly called lsof because it “lists openfiles“. And remember, in UNIX just about everything (including a network socket) is a file.
Interestingly, lsof is also the Linux/Unix command with the most switches. It has so many it has to use both minuses and pluses.
As you can see, lsof has a truly staggering number of options. You can use it to get information about devices on your system, what a given user is touching at any given point, or even what files or network connectivity a process is using.
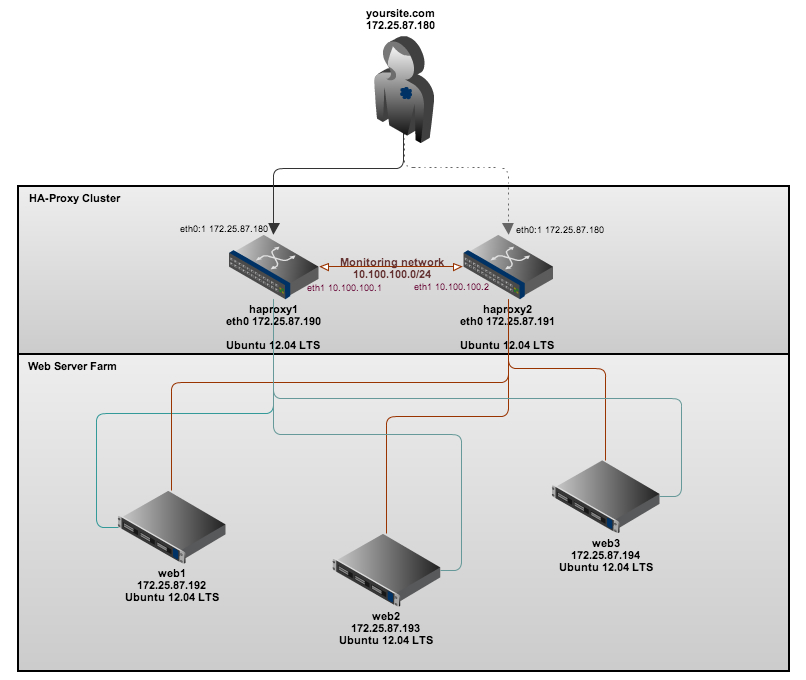
What is the main objective of this entire topology?
Redundancy and Load Sharing! Imagine a scenario where your single web server is receiving millions and millions of HTTP requests per second, the CPU load is going insane, as well as the memory usage, when suddenly “crash!”, the server dies without saying good-bye (probably because of some weird hardware out-stage that you certainly won’t have time to debug). Well, this simple scheme might lead you into a brand new world of possibilities
What is this going to solve?
Hardware Failures! We are going to have redundant hardware all over the place, if one goes down, another one will be immediately ready for taking its place. Also, by using load sharing schemes, this is going to solve our High Usage! issue. Balancing the load among every server on our “farm” will reduce the amount of HTTP request per server (but you already figured that out, right?).
Let’s set it up! Firstly, we’re not going to use a domain scheme (let’s keep it simple), make sure your /etc/hosts file looks exactly like the picture below on every machine:
Here are a few notes about how to set-up a high-availability web server farm using Ubuntu 12.04 LTS using a whole load of awesome software (HAProxy, HeartBeat, Watchdog and Nginx)
The setup
In my setup I have five virtual machines, these are named and used for the following:-
haproxy1 – Our first proxy (master)/load-balancer (running HAProxy, HeartBeat and Watchdog) [IP address: 172.25.87.190] haproxy2 – Our second proxy (failover)/load-balancer (running HAProxy, HeartBeat and Watchdog) [IP address: 172.25.87.191] web1 – Our first web server node (running nginx) [IP address: 172.25.87.192] web2 – Our second web server node (running nginx) [IP address: 172.25.87.193] web3 – Our third web server node (running nginx) [IP address: 172.25.87.194]
The servers are connected in the following way:-
In my next post I will also explain how to configure the web servers to point to a backend shared storage cluster (using NFS) and a MySQL cluster server to have a truly highly available web hosting platform.

 Graphs are added and removed via symlinks in the