Archive

Archives pour la catégorie ‘Système’

Ubuntu Linux Change Hostname (computer name)

02/10/2026 Comments off

I am a new Ubuntu Linux laptop user. I setup my computer name to ‘tom’ during installation but now I would like to change the computer name to ‘jerry’. Can you tell me how do I I remove tom and set it to jerry on Ubuntu Linux? How do I change the Ubuntu computer name from ‘ubuntu’ to ‘AvlinStar’? Can you tell me more about Ubuntu Linux change hostname command?

You can use the hostname command to see or set the system’s host name. The host name or computer name is usually at system startup in /etc/hostname file. Open the terminal application and type the following commands to set or change hostname or computer name on Ubuntu.

Display the current Ubuntu hostname

Simply type the following command:
$ hostname
Sample outputs:

Fig.01: Ubuntu Linux Show the hostname/computer name command

Ubuntu change hostname command

The procedure to change the computer name on Ubuntu Linux:

  1. Type the following command to edit /etc/hostname using nano or vi text editor:
    sudo nano /etc/hostname
    Delete the old name and setup new name.
  2. Next Edit the /etc/hosts file:
    sudo nano /etc/hosts
    Replace any occurrence of the existing computer name with your new one.
  3. Reboot the system to changes take effect:
    sudo reboot

Sample outputs:

Gif 01: Ubuntu Linux Change Hostname Command Demo
Gif 01: Ubuntu change the computer name demo

How to change the Ubuntu server hostname without a system restart?

Type the following commands:
$ sudo hostname new-server-name-here
Next edit the /etc/hostname file and update hostname:
$ sudo nano /etc/hostname
Finally, edit the /etc/hosts file and update the lines that reads your old-host-name:
$ sudo nano /etc/hosts
From:
127.0.1.1 old-host-name
To:
127.0.1.1 new-server-name-here
Save and close the file.

Ubuntu Linux Change Hostname Using hostnamectl

Systemd based Linux distro such as Ubuntu Linux 16.04 LTS and above can simply use the hostnamectl command to change hostname. To see current setting just type the following command:
$ hostnamectl
Sample outputs:

   Static hostname: nixcraft
         Icon name: computer-laptop
           Chassis: laptop
        Machine ID: 291893e6499e4d99891c3cf4b70a138b
           Boot ID: 9fda2365b77841649e40a141fde46537
  Operating System: Ubuntu 17.10
            Kernel: Linux 4.13.0-21-generic
      Architecture: x86-64

To change hostname from nixcraft to viveks-laptop, enter:
$ hostnamectl set-hostname viveks-laptop
$ hostnamectl

Categories: Réseau, Système Tags: , ,

Pure-FTPd et MySQL

30/09/2026 Comments off

Le logiciel pure-ftpd est l’un des serveurs FTP les plus simple à installer et configurer c’est pourquoi si vous cherchez à installer un serveur FTP rapidement sur votre serveur Linux, je ne peux que vous le recommander.
Aujourd’hui, nous allons voir comment utiliser pure-ftpd et MySQL simultanément pour permettre la séparation des tâches avec l’enregistrement des comptes utilisateurs dans la base de données et le reste du fonctionnement gérer par pure-ftpd. Le but du tutoriel n’étant pas de vous apprendre à installer et manipuler MySQL, je pars du principe que ce dernier est installé sur la même machine (ou une machine distante) que votre serveur FTP et que vous avez soit MySQL Workbench sous la main ou le client MySQL en ligne de commande pour la partie traitant des manipulations sur la base de donnée.

Installation du serveur Pure-FTPd-mysql

Pour utiliser MySQL avec votre serveur de FTP, il faut que ce dernier ai été compilé avec la commande “–with-mysql“. Heureusement pour nous, plutôt que de ce compliquer la vie à compiler les sources du serveur, nous allons directement installer le paquet tout prêt à l’usage nommé : pure-ftpd-mysql.
Même si on vous conseil d’installer “pure-ftpd” ou même qu’on vous demande de le désinstaller si vous l’avez déjà installé, dite oui pour continuer l’installation.

sudo apt install pure-ftpd-mysql

Note : Si vous avez votre serveur FTP déjà en cours de production, l’installation de cette version ne perturbera en rien vos utilisateurs et vous pouvez continuer la suite de ce tutoriel puisque le redémarrage ne sera nécessaire qu’à la fin.

Création de la Base de données

A partir de votre interface PHPMyAdmin ou du client MySQL, vous allez créer un utilisateur ainsi qu’une base de données associés à ce compte.

Création d’un compte utilisateur en requête SQL.

CREATE USER 'pureftpd' identified by 'pwdftp';

Création de la base de donnée et une table qui servira à contenir les comptes utilisateurs.

CREATE DATABASE pureftpd;

Association du compte utilisateur “pureftpd” avec la table “users” en lui attribuant les droits de lecture, écriture, mise à jour et suppression.

GRANT SELECT, INSERT, UPDATE, DELETE ON '*.pureftpd' TO 'pureftpd';

Création de la table où les utilisateurs seront enregistrés.

CREATE TABLE users (
Id int(11) NOT NULL auto_increment PRIMARY KEY,
User varchar(32) NOT NULL default '' UNIQUE KEY,
Password varchar(64) NOT NULL default '',
Uid int(3) NOT NULL default 33,
Gid int(3) NOT NULL default 33,
Dir varchar(255) NOT NULL default '',
QuotaSize int(4) NOT NULL default 250,
ULBandwidth int(2) NOT NULL default 10,
DLBandwidth int(2) NOT NULL default 10
);
Lire la suite…
Categories: Bases de données, Réseau, Système Tags: ,

How to monitor a log file on Linux with logwatch

29/09/2026 Comments off

Linux operating system and many applications create special files commonly referred to as « logs » to record their operational events. These system logs or application-specific log files are an essential tool when it comes to understanding and troubleshooting the behavior of the operating system and third-party applications. However, log files are not precisely what you would call « light » or « easy » reading, and analyzing raw log files by hand is often time-consuming and tedious. For that reason, any utility that can convert raw log files into a more user-friendly log digest is a great boon for sysadmins.

logwatch is an open-source log parser and analyzer written in Perl, which can parse and convert raw log files into a structured format, making a customizable report based on your use cases and requirements. In logwatch, the focus is on producing more easily consumable log summary, not on real-time log processing and monitoring. As such, logwatch is typically invoked as an automated cron task with desired time and frequency, or manually from the command line whenever log processing is needed. Once a log report is generated, logwatch can email the report to you, save it to a file, or display it on the screen.

A logwatch report is fully customizable in terms of verbosity and processing coverage. The log processing engine of logwatch is extensible, in a sense that if you want to enable logwatch for a new application, you can write a log processing script (in Perl) for the application’s log file, and plug it under logwatch.

One downside of logwatch is that it does not include in its report detailed timestamp information available in original log files. You will only know that a particular event was logged in a requested range of time, and you will have to access original log files to get exact timing information.

Installing Logwatch

On Debian and derivatives:

# aptitude install logwatch

On Red Hat-based distributions:

# yum install logwatch

Configuring Logwatch

During installation, the main configuration file (logwatch.conf) is placed in /etc/logwatch/conf. Configuration options defined in this file override system-wide settings defined in /usr/share/logwatch/default.conf/logwatch.conf.

If logwatch is launched from the command line without any arguments, the custom options defined in /etc/logwatch/conf/logwatch.conf will be used. However, if any command-line arguments are specified with logwatch command, those arguments in turn override any default/custom settings in /etc/logwatch/conf/logwatch.conf.

In this article, we will customize several default settings of logwatch by editing /etc/logwatch/conf/logwatch.conf file.

Detail = <Low, Med, High, or a number>

« Detail » directive controls the verbosity of a logwatch report. It can be a positive integer, or High, Med, Low, which correspond to 10, 5, and 0, respectively.

MailTo = [email protected]

« MailTo » directive is used if you want to have a logwatch report emailed to you. To send a logwatch report to multiple recipients, you can specify their email addresses separated with a space. To be able to use this directive, however, you will need to configure a local mail transfer agent (MTA) such as sendmail or Postfix on the server where logwatch is running.

Range = <Yesterday|Today|All>

« Range » directive specifies the time duration of a logwatch report. Common values for this directive are Yesterday, Today or All. When « Range = All » is used, « Archive = yes » directive is also needed, so that all archived versions of a given log file (e.g., /var/log/maillog, /var/log/maillog.X, or /var/log/maillog.X.gz) are processed.

Besides such common range values, you can also use more complex range options such as the following.

  • Range = « 2 hours ago for that hour »
  • Range = « -5 days »
  • Range = « between -7 days and -3 days »
  • Range = « since September 15, 2014 »
  • Range = « first Friday in October »
  • Range = « 2014/10/15 12:50:15 for that second »

To be able to use such free-form range examples, you need to install Date::Manip Perl module from CPAN. Refer to this post for CPAN module installation instructions.

Service = <service-name-1>
Service = <service-name-2>
. . .

« Service » option specifies one or more services to monitor using logwath. All available services are listed in /usr/share/logwatch/scripts/services, which cover essential system services (e.g., pam, secure, iptables, syslogd), as well as popular application services such as sudo, sshd, http, fail2ban, samba. If you want to add a new service to the list, you will have to write a corresponding log processing Perl script, and place it in this directory.

If this option is used to select specific services, you need to comment out the line « Service = All » in /usr/share/logwatch/default.conf/logwatch.conf.

14948933564_f6fb05382d_o

Format = <text|html>

« Format » directive specifies the format (e.g., text or HTML) of a logwatch report.

Output = <file|mail|stdout>

« Output » directive indicates where a logwatch report should be sent. It can be saved to a file (file), emailed (mail), or shown to screen (stdout).

Lire la suite…

Categories: Système Tags: ,

How to Backup Linux? 15 rsync Command Examples

28/09/2026 Comments off

rsync stands for remote sync.

rsync is used to perform the backup operation in UNIX / Linux.

rsync utility is used to synchronize the files and directories from one location to another in an effective way. Backup location could be on local server or on remote server.

Important features of rsync

  • Speed: First time, rsync replicates the whole content between the source and destination directories. Next time, rsync transfers only the changed blocks or bytes to the destination location, which makes the transfer really fast.
  • Security: rsync allows encryption of data using ssh protocol during transfer.
  • Less Bandwidth: rsync uses compression and decompression of data block by block at the sending and receiving end respectively. So the bandwidth used by rsync will be always less compared to other file transfer protocols.
  • Privileges: No special privileges are required to install and execute rsync

Syntax

$ rsync options source destination

Source and destination could be either local or remote. In case of remote, specify the login name, remote server name and location.

Example 1. Synchronize Two Directories in a Local Server

To sync two directories in a local computer, use the following rsync -zvr command.

$ rsync -zvr /var/opt/installation/inventory/ /root/temp
building file list ... done
sva.xml
svB.xml
.
sent 26385 bytes  received 1098 bytes  54966.00 bytes/sec
total size is 44867  speedup is 1.63
$

In the above rsync example:

  • -z is to enable compression
  • -v verbose
  • -r indicates recursive

Now let us see the timestamp on one of the files that was copied from source to destination. As you see below, rsync didn’t preserve timestamps during sync.

$ ls -l /var/opt/installation/inventory/sva.xml /root/temp/sva.xml
-r--r--r-- 1 bin  bin  949 Jun 18  2009 /var/opt/installation/inventory/sva.xml
-r--r--r-- 1 root bin  949 Sep  2  2009 /root/temp/sva.xml

Example 2. Preserve timestamps during Sync using rsync -a

rsync option -a indicates archive mode. -a option does the following,

  • Recursive mode
  • Preserves symbolic links
  • Preserves permissions
  • Preserves timestamp
  • Preserves owner and group

Now, executing the same command provided in example 1 (But with the rsync option -a) as shown below:

$ rsync -azv /var/opt/installation/inventory/ /root/temp/
building file list ... done
./
sva.xml
svB.xml
.
sent 26499 bytes  received 1104 bytes  55206.00 bytes/sec
total size is 44867  speedup is 1.63
$

As you see below, rsync preserved timestamps during sync.

$ ls -l /var/opt/installation/inventory/sva.xml /root/temp/sva.xml
-r--r--r-- 1 root  bin  949 Jun 18  2009 /var/opt/installation/inventory/sva.xml
-r--r--r-- 1 root  bin  949 Jun 18  2009 /root/temp/sva.xml

Lire la suite…

Categories: Réseau, Système Tags: ,

Collect & visualize your logs with Logstash, Elasticsearch & Redis

27/09/2026 Comments off

Source: michael.bouvy.net

Update of December 6th : although Logstash does the job as a log shipper, you might consider replacing it with Lumberjack / Logstash Forwarder, which needs way less resources, and keep Logstash on your indexer to collect, transform and index your logs data (into ElasticSearch) : check out my latest blog post on the topic.

Kibana_medium

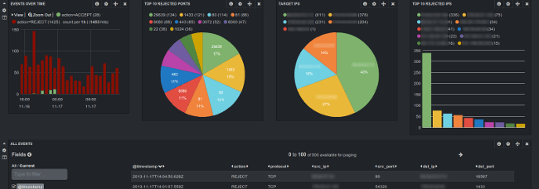
Kibana Dashboard


Even if you manage a single Linux server, you probably already know how hard it is to keep an eye on what’s going on with your server, and especially tracking logs data. And this becomes even worse when you have several (physical or virtual) servers to administrate.


Although Munin is very helpful monitoring various informations from my servers / VMs, I felt the need of something more, and bit less static / more interactive.

There are 3 kind of logs I especially wanted to track :

  • Apache 2 access logs
  • iptables logs
  • Syslogs

After searching arround on the internet for a great tool that would help me, I read about the open source log management tool Logstash which seems to perfectly suit a (major) part of my needs : logs collecting / processing.

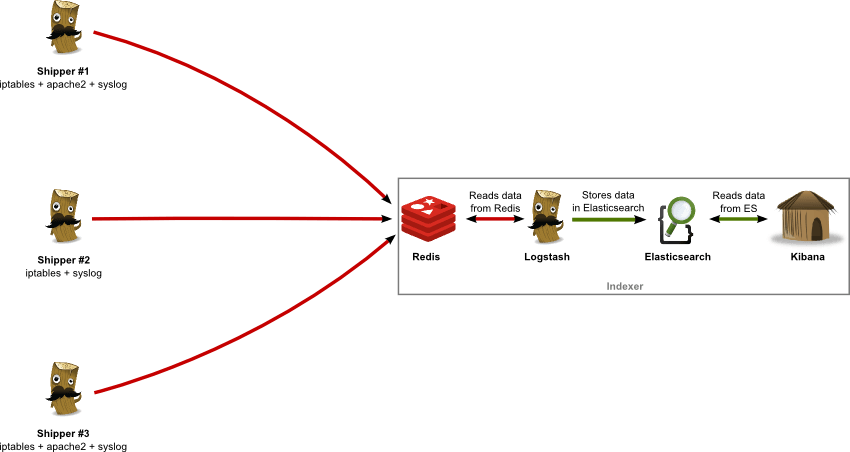
For the purpose of this post, I will take the following network architecture and assume and I want to collect my Apache, iptables, system logs from servers 1/2/3 (“shippers”) on server 4 (“indexer”) and visualize them :

logstach-archi1

As you can see, I am using 4 complementary applications, the role of each one being :

  • Logstash : logs collector, processor and shipper (to Redis) on log “shippers” 1-3 ; logs indexer on server 4 (reads from Redis, writes to Elasticsearch)
  • Redis : logs data broker, receiving data from log “shippers” 1-3
  • Elasticsearch : logs data persistent storage
  • Kibana : (time-based) logs data visualization (graphs, tables, etc.)

Lire la suite…

Categories: Système Tags: , , ,