Tmux, à l’instar de Screen, est un multiplexeur de terminaux, outil permettant d’exploiter plusieurs terminaux au sein d’un seul et même affichage.
Installation
Tmux n’est pas installé par défaut. Pour l’installer à l’aide d’un utilitaire graphique il suffit d’Installer le paquetstmux. Par l’installer avec apt-get depuis un terminal, il suffit de saisir la commande suivante :
If you run a wordpress blog these days, you are likely to experience brute force attacks where nefarious individuals attempt to break in to your website by quickly a list of userids and passwords against your wp-login.php. Here’s how I automated detection and blocking of WordPress brute force login attacks.
Detecting a WordPress Brute Force Attack
One can typically detect a wordpress brute force attack by parsing through your webserver’s access_log file. The access_log file records all of the access requests that a web server handles. A brute force attack typically will have frequent and numerous attempts to the wp-login.php file as shown below:
Example: In the access_log file below, we detect a brute force login attack on our WordPress blog. We detected it by noticing frequent and constant requests to the wp-login.php file.
Typically in an event like this, I lookup the IP address in the ARIN database as I showed in a previous article: What Personal Information Can You Get From Your Web Server? Frequently, I find that the address is from APAC or RIPE addresses.
WordPress is one of the most popular content publishing platform used by some of the very high traffic website. Beauty of the wordpress is in its simplicity. If you will setup your WordPress correctly then your website performance will be fantastic. In this article we will explore various aspect of the WordPress Performance Tuning. Before going further let me clear that why you need to optimize your WordPress website performance.
Why you should spend time on WordPress Performance Tuning ?
Performance tuning or Optimization is required due to following reason:
If you will correctly optimize or tune your WordPress performance then your visitor experience will be better.
Search engines are giving high preference to high speed website. So your SEO will be improved.
Sometime while doing your WordPress performance tuning you will analyzed and remove unwanted thing from your WordPress which reduce your server work. So your server will have less load.
Tool / Plugin / Stuff you need while WordPress Performance tuning
WordPress performance tuning does not mean to only changing some configuration of your WordPress. There are several area where you need to fine tune like apache(your webserver), Mysql etc. So before going further you need following tool/plugin
Installation of plugin w3 total plugin.
Firefox web browser with firebug tool.
Google Page Speed Test or GT Metrix.
SSH connection to your server (only required if you want to tune Apache and MySQL performance).
A good Internet speed.
Before going further for your WordPress Performance Tuning please arrange above written tool.
Analyze your WordPress Performance
Before going to optimize your WordPress Performance you need to analyze that whether your website performance is good or bad. Or in other word we can say that you need to check whether your website is served quickly or not. Following are the factor which mainly affect your website performance and you need to check.
Time taken to load your web page
Number of CSS, js and Images are getting downloaded on every request
CSS and JS are placed correctly or not.
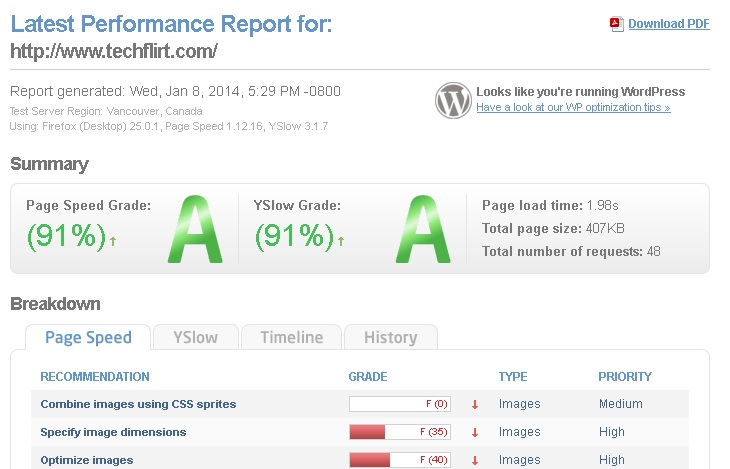
You can check your website performance in either Google Page Speed or Gtmetrix. I prefer to use Gtmetrix. Both tool will gives rating to your website Speed and suggestion to improve your website performance further. Gtmetrix will also provide you the timeline waterfall(what is repose time of your website and how many images, css , js or other resources are getting downloaded) of your website. I prefer Gtmetrix because of TimeLine waterfall feature. You will get following type snapshot for your website in Gtmetrix
In above snapshot you can see the following 4 tab
Page Speed : In this tab you can find your website performance analysis with GooglePageSpeed.
YSlow : In this tab you can find your website performance analysis with YSlow.
TimeLine : In this tab you can find your website page load water fall.
History: In this tab you can find previous history of your website page speed test if you did the test in in future.
Graphs are added and removed via symlinks in the /etc/munin/plugins/ directory of the node.
To remove a graph you must remove the symlink and restart the node:
rm /etc/munin/plugins/diskstats
service munin-node restart
To add a graph you must add a symlink in the plugins directory to an executable. eg:
ln -s /usr/share/munin/plugins/diskstats /etc/munin/plugins/diskstats
service munin-node restart
When you restart munin-node it runs immediately and any issues with the plugins appears in /var/log/munin/munin-node.log. If all is going well you’ll see a CONNECT logged every cycle; this records the fact that the master connected to collect the latest data.
Process Backgrounded
2014/03/10-15:59:47 Munin::Node::Server (type Net::Server::Fork) starting! pid(32231)
Resolved [*]:4949 to [::]:4949, IPv6
Not including resolved host [0.0.0.0] IPv4 because it will be handled by [::] IPv6
Binding to TCP port 4949 on host :: with IPv6
2014/03/10-16:00:04 CONNECT TCP Peer: "[::ffff:203.28.51.227]:45965" Local: "[::ffff:50.23.111.122]:4949"
2014/03/10-16:05:04 CONNECT TCP Peer: "[::ffff:203.28.51.227]:46109" Local: "[::ffff:50.23.111.122]:4949"
2014/03/10-16:10:04 CONNECT TCP Peer: "[::ffff:203.28.51.227]:46109" Local: "[::ffff:50.23.111.122]:4949"
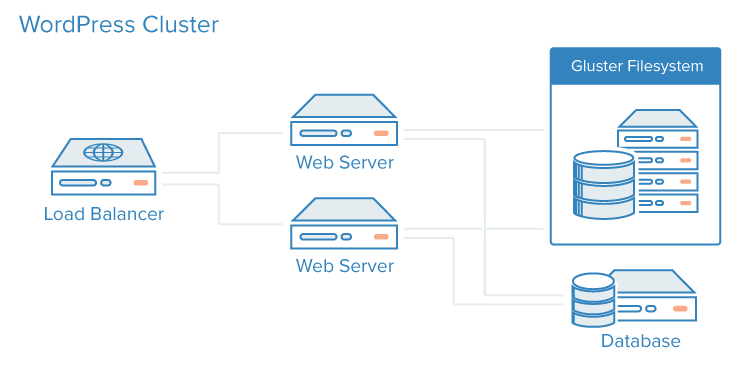
In this guide we will create and deploy a scalable WordPress instance consisting of a MySQL database server, a GlusterFS distributed filesystem, Nginx web servers and an Nginx load balancer. By using user-data and droplet meta-data we will automate the deployment of our site. Finally we will provide a Ruby script which will automate this entire process and ease the creation of scalable WordPress sites. Through this tutorial you will learn about the power and flexibility of user-data and droplet meta-data in deploying services on DigitalOcean.
Step One – Planning our Deployment
The deployment we create in this tutorial will consist of a single MySQL database server, multiple GlusterFS servers in a cluster, multiple Nginx web servers and a single Nginx load balancer.
Before we begin we should know:
What size droplet we will use for our MySQL server
How many GlusterFS nodes we will create
What size our GlusterFS nodes will be
How many web server nodes we will need
What size droplets we will use for our web servers
What size droplet we will use for our load balancer
The domain name we will use for our new site
We can add additional nodes or scale up the nodes we created if we need to later. Once we have decided on these details we can begin deploying our site.
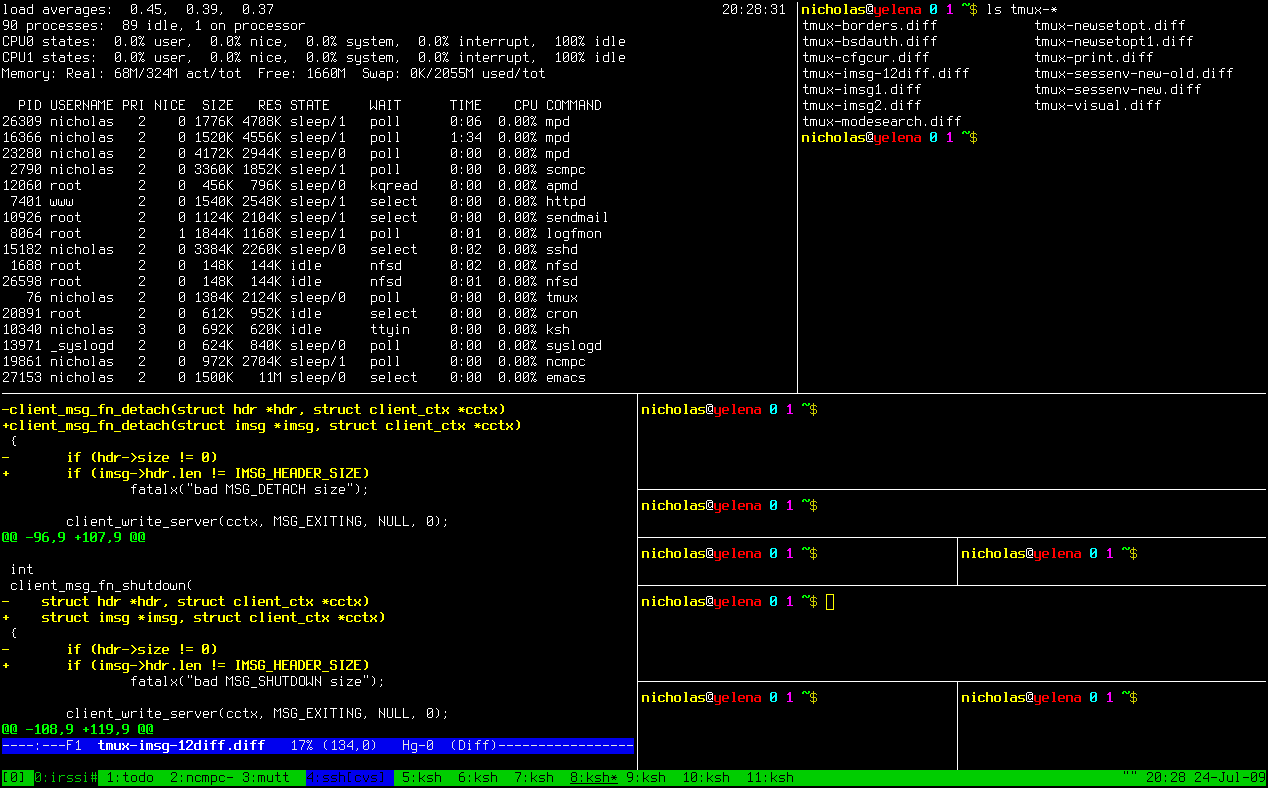 , à l’instar de Screen, est un multiplexeur de terminaux, outil permettant d’exploiter plusieurs terminaux au sein d’un seul et même affichage.