When you are using Linux command line frequently, using the history effectively can be a major productivity boost. In fact, once you have mastered the 15 examples that I’ve provided here, you’ll find using command line more enjoyable and fun.
1. Display timestamp using HISTTIMEFORMAT
Typically when you type history from command line, it displays the command# and the command. For auditing purpose, it may be beneficial to display the timepstamp along with the command as shown below.
# export HISTTIMEFORMAT='%F %T '
# history | more
1 2008-08-05 19:02:39 service network restart
2 2008-08-05 19:02:39 exit
3 2008-08-05 19:02:39 id
4 2008-08-05 19:02:39 cat /etc/redhat-release
Need to monitor Linux server performance? Try these built-in command and a few add-on tools. Most Linux distributions are equipped with tons of monitoring. These tools provide metrics which can be used to get information about system activities. You can use these tools to find the possible causes of a performance problem. The commands discussed below are some of the most basic commands when it comes to system analysis and debugging server issues such as:
Finding out bottlenecks.
Disk (storage) bottlenecks.
CPU and memory bottlenecks.
Network bottlenecks.
#1: top – Process Activity Command
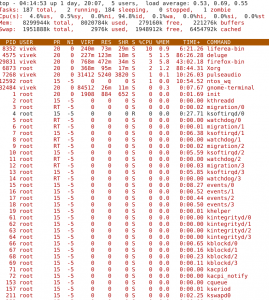
The top program provides a dynamic real-time view of a running system i.e. actual process activity. By default, it displays the most CPU-intensive tasks running on the server and updates the list every five seconds.
Commonly Used Hot Keys
The top command provides several useful hot keys:
Hot Key
Usage
t
Displays summary information off and on.
m
Displays memory information off and on.
A
Sorts the display by top consumers of various system resources. Useful for quick identification of performance-hungry tasks on a system.
f
Enters an interactive configuration screen for top. Helpful for setting up top for a specific task.
o
Enables you to interactively select the ordering within top.