Archive

Archives pour la catégorie ‘Système’

How to configure a syslog server with rsyslog on Linux
24/06/2024 Comments off

rsyslog linuxA syslog server represents a central log monitoring point on a network, to which all kinds of devices including Linux or Windows servers, routers, switches or any other hosts can send their logs over network. By setting up a syslog server, you can filter and consolidate logs from different hosts and devices into a single location, so that you can view and archive important log messages more easily.

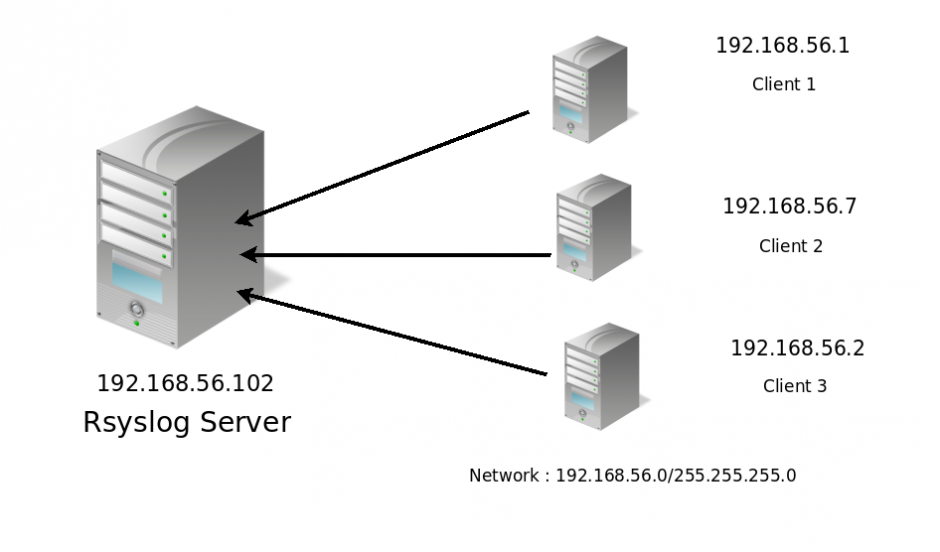
On most Linux distributions, rsyslog is the standard syslog daemon that comes pre-installed. Configured in a client/server architecture, rsyslog can play both roles; as a syslog server rsyslog can gather logs from other devices, and as a syslog client, rsyslog can transmit its internal logs to a remote syslog server.

In this tutorial, we cover how to configure a centralized syslog server using rsyslog on Linux. Before we go into the details, it is instructive to go over syslog standard first.

Basic of Syslog Standard

When logs are collected with syslog mechanism, three important things must be taken into consideration:

  • Facility level: what type of processes to monitor
  • Severity (priority) level: what type of log messages to collect
  • Destination: where to send or record log messages

Let’s take a look at how the configuration is defined in more detail.

The facility levels define a way to categorize internal system processes. Some of the common standard facilities in Linux are:

  • auth: messages related to authentication (login)
  • cron: messages related to scheduled processes or applications
  • daemon: messages related to daemons (internal servers)
  • kernel: messages related to the kernel
  • mail: messages related to internal mail servers
  • syslog: messages related to the syslog daemon itself
  • lpr: messages related to print servers
  • local0 – local7: messages defined by user (local7 is usually used by Cisco and Windows servers)

The severity (priority) levels are standardized, and defined by using standard abbreviation and an assigned number with number 7 being the highest level of all. These levels are:

  • emerg: Emergency – 0
  • alert: Alerts – 1
  • crit: Critical – 2
  • err: Errors – 3
  • warn: Warnings – 4
  • notice: Notification – 5
  • info: Information – 6
  • debug: Debugging – 7

Finally, the destination statement enforces a syslog client to perform one of three following tasks: (1) save log messages on a local file, (2) route them to a remote syslog server over TCP/UDP, or (3) send them to stdout such as a console.

In rsyslog, syslog configuration is structured based on the following schema.

[facility-level].[severity-level]  [destination]
Lire la suite…

Categories: Système Tags: , ,

80 Linux Monitoring Tools for SysAdmins

22/06/2024 Comments off

Source: ServerDensity

The industry is hotting up at the moment, and there are more tools than you can shake a stick at. Here lies the most comprehensive list on the Internet (of monitoring tools). Featuring over 80 ways to monitor your machines. Within this article we outline:

  • Command line tools
  • Network related
  • System related monitoring
  • Log monitoring tools
  • Infrastructure monitoring tools

It’s hard work monitoring and debugging performance problems, but it’s easier with the right tools at the right time. But how much of your valuable time do you think it would take you to investigate all of these tools and find out which one is best for you?

Why not check out Server Density first, it has a beautiful UI, an api that’s easy to use and alerts that will keep downtime to a minimum.

Top 10  System Monitoring Tools

1. Top

top
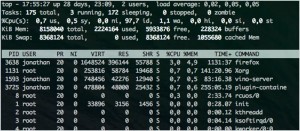
This is a small tool which is pre-installed in many unix systems. When you want an overview of all the processes or threads running in the system: top is a good tool. You can order these processes on different criteria and the default criteria is CPU.

2. htop

htop
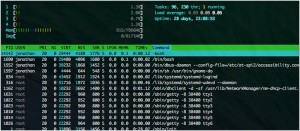
Htop is essentially an enhanced version of top. It’s easier to sort by processes. It’s visually easier to understand and has built in commands for common things you would like to do. Plus it’s fully interactive.

3. atop

Atop monitors all processes much like top and htop, unlike top and htop however it has daily logging of the processes for long-term analysis. It also shows resource consumption by all processes. It will also highlight resources that have reached a critical load.

4. apachetop

Apachetop monitors the overall performance of your apache webserver. It’s largely based on mytop. It displays current number of reads, writes and the overall number of requests processed.

5. ftptop

ftptop gives you basic information of all the current ftp connections to your server such as the total amount of sessions, how many are uploading and downloading and who the client is.

Lire la suite…

Categories: Système Tags: ,

4 outils utiles pour rechercher et supprimer des fichiers en double sous Linux

20/06/2024 Comments off

L’organisation de votre répertoire personnel ou même de votre système peut être particulièrement difficile si vous avez l’habitude de télécharger toutes sortes de choses sur Internet.

Souvent, vous constaterez que vous avez téléchargé le même mp3, pdf, epub (et toutes sortes d’autres extensions de fichiers) et que vous l’avez copié dans différents répertoires. Cela peut encombrer vos répertoires de toutes sortes de choses dupliquées inutiles.

Dans ce didacticiel, vous allez apprendre à rechercher et à supprimer des fichiers en double sous Linux à l’aide des outils de ligne de commande rdfind et fdupes, ainsi qu’à l’aide d’outils d’interface graphique appelés DupeGuru et FSlint.

Une note de prudence – faites toujours attention à ce que vous supprimez sur votre système car cela peut entraîner une perte de données indésirable. Si vous utilisez un nouvel outil, essayez-le d’abord dans un répertoire de test où la suppression de fichiers ne posera pas de problème.

Rdfind – Trouve les fichiers en double sous Linux

Rdfind provient de la recherche de données redondantes. C’est un outil gratuit utilisé pour trouver des fichiers en double dans ou dans plusieurs répertoires. Il utilise la somme de contrôle et trouve les doublons basés sur le fichier contient non seulement des noms. Lire la suite…

Categories: Système Tags: , , ,

Get Weather Reports from the Command Line with finger

16/06/2024 Comments off
weather-forecast-command-line-finger-graph-no2-610x433

weather-forecast-command-line-finger-graph


Checking weather: purpose of the command

There’s no shortage of methods to retrieve a weather report, the web is full of weather resources, everyones iPhone, Apple Watch, and smartphone has a weather app, Siri can tell you the weather, and you can even get the current weather in the menu bar of OS X or from Spotlight on the Mac too.

But for command line users, none of those options are particularly ideal, since it means leaving the command line and the task at hand.

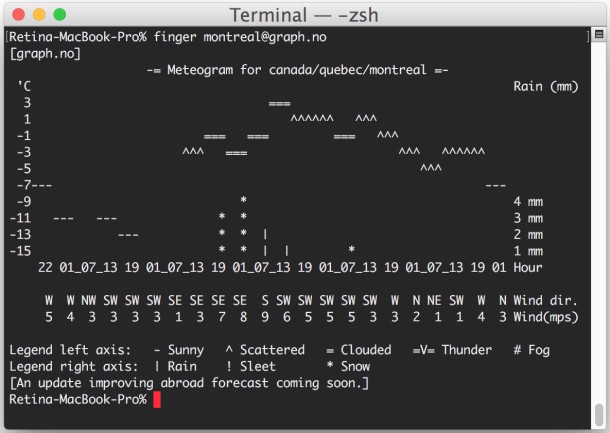
Thanks to an interesting usage of the finger utility, you can quickly retrieve a weather report and weather forecast for virtually any city in the world, right from the command line.

With this trick you’ll see the temperature forecast (in celsius) for the day, wind direction and wind speed, precipitation and precipitation type (rain, showers, sleet, snow, etc), depth of precipitation, and more. This works with any command line that has the finger tool, whether you’re in Mac OS X, linux, BSD, Windows, it doesn’t matter, it will work the same.

To try this out yourself on the Mac, launch the OS X Terminal found in /Applications/Utilities/ and type the following command syntax:

finger (city name)@graph.no

For example, to get the weather forecast for Montreal Canada, you would use the following syntax at the command line:

finger [email protected]

Lire la suite…

Categories: Système Tags: ,

Running Commands on a Remote Linux / UNIX Host

14/06/2024 Comments off

Remote Linux Commands

commands remote linuxYou would like to execute a command on a remote Linux/FreeBSD/Solaris/UNIX host and have the result displayed locally. Once result obtained it can be used by local script or program. A few examples:
=> File system and disk information

=> Get user information

=> Find out all running process

=> Find out if particular service is running or not etc

You can use rsh or ssh for this purpose. However, for security reason you should always use the ssh and NOT rsh. Please note that remote system must run the OpenSSH server.

Syntax for running command on a remote host:
ssh [USER-NAME]@[REMOTE-HOST] [command or script]

Where,

  • ssh: ssh (SSH client) is a program for logging into a remote machine and for executing commands on a remote machine.
  • USER-NAME: Remote host user name.
  • REMOTE-HOST: Remote host ip-address or host name, such as my-site.com.
  • command or script: Command or shell script is executed on the remote host instead of a login shell.

Examples

(A) Get disk information from a server called my-site.com:
$ ssh [email protected] df -h

(B) List what ports are open on remote host
$ ssh [email protected] netstat -vatn

(C) Reboot remote host:
$ ssh [email protected] reboot

(D) Restart mysql server (please note enclosed multiple command line arguments using a single or double quotes)
$ ssh [email protected] '/etc/init.d/mysql restart'

(E) Get memory information and store result/output to local file /tmp/memory.status:
$ ssh [email protected] 'free -m' > /tmp/memory.status

(G) You can also run multiple command or use the pipes, following command displays memory in format of « available memory = used free memory » :
$ ssh [email protected] free -m | grep "Mem:" | awk '{ print "Total memory (used free): " $3 " " $4 " = " $2 }'

See how to configure ssh for password less login using public key based authentication.

=> Related: shell script to get uptime, disk usage, cpu usage, RAM usage, system load, etc. from multiple Linux servers and output the information on a single server in a html format.

Source: NixCraft

Categories: Système Tags: , ,