Archive

Archives pour la catégorie ‘Réseau’

iptables command in Linux

25/09/2026 Comments off

Source: geekforgeeks

iptables is a Linux command-line firewall tool used to control and secure network traffic by defining packet-filtering rules. It works with the Netfilter framework in the Linux kernel to decide whether packets are accepted, dropped, or forwarded.

  • Controls incoming, outgoing, and forwarded traffic based on IP addresses, ports, and protocols.
  • Uses tables, chains, and rules to define how network packets should be handled.
  • Performs actions such as ACCEPT, DROP, REJECT, or FORWARD when packets match rules.
  • Helps protect servers and networks by allowing trusted traffic and blocking unauthorized access.

Core Components of iptables

iptables works using a structured model consisting of tables, chains, rules, and targets.

Tables in Iptables

Tables are collections of chains that define how packets should be processed for specific purposes, iptables uses different tables for handling various types of packet processing.

  • filter: Default used table for packet filtering. It includes chains like INPUT, OUTPUT and FORWARD.
  • nat: Related to Network Address Translation. It includes PREROUTING and POSTROUTING chains.
  • mangle: For specialised packet alteration. Inbuilt chains include PREROUTING and OUTPUT.
  • raw: Configures exemptions from connection tracking. Built-in chains are PREROUTING and OUTPUT.
  • security: Used for Mandatory Access Control

Built-in Chains of Tables in Iptables

Chains are ordered lists of rules that determine what action should be taken when a packet matches certain conditions. Each table contains predefined chains

  • INPUT: A set of rules for packets destined to localhost sockets.
  • FORWARD: For packets routed through the device.
  • OUTPUT: It is locally generated packets, meant to be transmitted outside.
  • PREROUTING: It is used for modifying packets as they arrive.
  • POSTROUTING: IIt helps in modifying packets as they are leaving.

Rules

Rules are the conditions applied to packets within chains. A rule matches a packet if it meets certain criteria. Common criteria include:

  • Source IP address: Blocks or allows traffic coming from a specific computer or device. Example: Stop all traffic from 192.168.1.100.
  • Destination IP address: Blocks or allows traffic going to a specific computer or device. Example: Allow traffic only to 10.0.0.5.
  • Protocol type: Filters traffic based on the type of communication, like TCP (web), UDP, or ICMP (ping).
  • Port number: Controls access to certain services or programs on a computer. Example: Allow web traffic on port 80 but block SSH on port 22.

Targets (Actions)

Targets specify what happens when a packet matches a rule:

  • ACCEPT: Allow the packet to continue its path.
  • DROP: Silently discard the packet with no response.
  • REJECT: Discard the packet but send an error response to the sender.
  • QUEUE: Send the packet to userspace for custom processing.
  • RETURN: Stop processing the current chain and resume at the previous chain.

Example:

Imagine you want to block SSH from a specific IP but allow all other traffic:

iptables -A INPUT -p tcp --dport 22 -s 192.168.1.100 -j DROP
  • Chain: INPUT
  • Protocol: TCP
  • Destination Port: 22 (SSH)
  • Source IP: 192.168.1.100
  • Target: DROP

Output:

This rule drops incoming SSH connections from 192.168.1.100 while letting other traffic pass normally.

Syntax

iptables [options] [chain] [rule specification] [target]
  • options: Specifies the action to perform (like adding, deleting, or listing rules)
  • chain: Defines where the rule is applied (INPUT, OUTPUT, FORWARD)
  • rule specification: Conditions to match packets (protocol, port, IP address, etc.)
  • target: Action to take on matched packets (ACCEPT, DROP, REJECT)
Lire la suite…

How to analyze and view Apache web server logs interactively on Linux

01/07/2024 Comments off

analyze apache logsWhether you are in the web hosting business, or run a few web sites on a VPS yourself, chances are you want to display visitor statistics such as top visitors, requested files (dynamic or static), used bandwidth, client browsers, and referring sites, and so forth.

GoAccess is a command-line log analyzer and interactive viewer for Apache or Nginx web server. With this tool, you will not only be able to browse the data mentioned earlier, but also parse the web server logs to dig for further data as well – and all of this within a terminal window in real time. Since as of today most web servers use either a Debian derivative or a Red Hat based distribution as the underlying operating system, I will show you how to install and use GoAccess in Debian and CentOS.

Installing GoAccess on Linux

In Debian, Ubuntu and derivatives, run the following command to install GoAccess:

# aptitude install goaccess

In CentOS, you’ll need to enable the EPEL repository and then:

# yum install goaccess

In Fedora, simply use yum command:

# yum install goaccess

If you want to install GoAccess from the source to enable further options (such as GeoIP location), install required dependencies for your operating system, and then follow these steps:

# wget http://tar.goaccess.io/goaccess-0.8.5.tar.gz
# tar -xzvf goaccess-0.8.5.tar.gz
# cd goaccess-0.8.5/
# ./configure --enable-geoip
# make
# make install

That will install version 0.8.5, but you can always verify what is the latest version in the Downloads page of the project’s web site.

Since GoAccess does not require any further configurations, once it’s installed you are ready to go.

Running GoAccess

To start using GoAccess, just run it against your Apache access log.

For Debian and derivatives:

# goaccess -f /var/log/apache2/access.log

For Red Hat based distros:

# goaccess -f /var/log/httpd/access_log

When you first launch GoAccess, you will be presented with the following screen to choose the date and log format. As explained, you can toggle between options using the spacebar and proceed with F10. As for the date and log formats, you may want to refer to the Apache documentation if you need to refresh your memory.

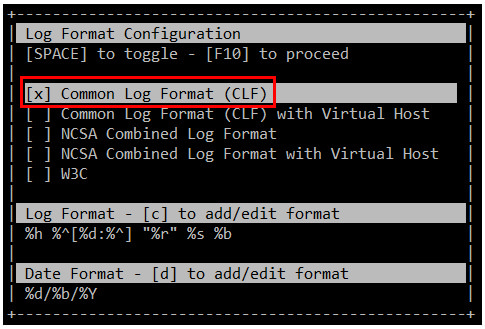
In this case, Choose Common Log Format (CLF):

15868350373_30c16d7c30

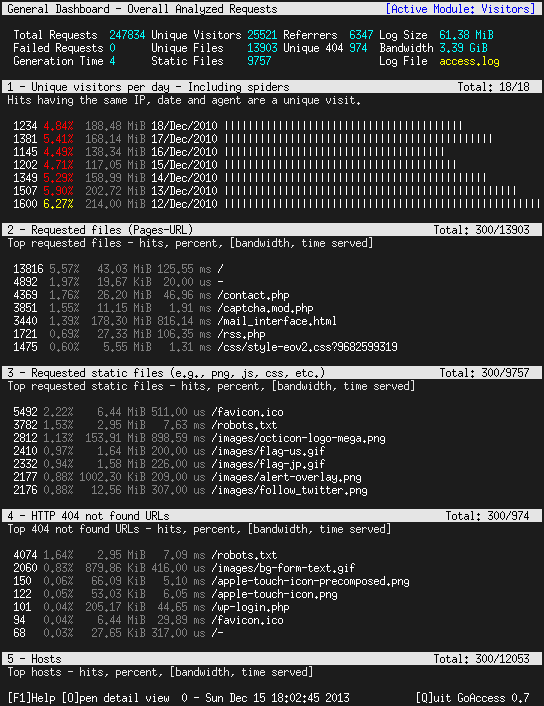
and then press F10. You will be presented with the statistics screen. For the sake of brevity, only the header, which shows the summary of the log file, is shown in the next image:

16486742901_7a35b5df69_b

Lire la suite…

How to measure packets per second or throughput on high speed network interface

30/06/2024 Comments off

throughput networkThere are many traffic monitoring tools available on Linux, which can monitor/classify network traffic, and report real-time traffic statistics in fancy user interfaces. Most of these tools (e.g., ntopng, iftop) are powered by libpcap, which is a packet capture library used to monitor network traffic in user space. Despite their versatility, however, libpcap-based network monitoring tools cannot scale to handle traffic on multi Gigabit rate network interfaces, due to the overhead associated with user-space packet capture.
In this tutorial, I will present simple shell scripts that can monitor network traffic on per-interface basis, without relying on slow libpcap library. These scripts are fast enough to support multi Gigabit rates, but only suitable if you are interested in « aggregate » network statistics on per interface basis.

The secret for the scripts lies in sysfs virtual filesystem which is used by the kernel to export device- or driver-related information to user space. Network interface related statistics are exported via /sys/class/net/<ethX>/statistics.

For example, the statistics on eth0 interface are found in these files:

  • /sys/class/net/eth0/statistics/rx_packets: number of packets received
  • /sys/class/net/eth0/statistics/tx_packets: number of packets transmitted
  • /sys/class/net/eth0/statistics/rx_bytes: number of bytes received
  • /sys/class/net/eth0/statistics/tx_bytes: number of bytes transmitted
  • /sys/class/net/eth0/statistics/rx_dropped: number of packets dropped while received
  • /sys/class/net/eth0/statistics/tx_dropped: number of packets dropped while transmitted

The numbers stored in the files are automatically refreshed in real-time by the kernel. Therefore, you can write scripts that calculate traffic statistics based on these files.

The following are two such scripts (thanks to joemiller). The first script counts the number of packets per second, received (RX) or sent (TX) on an interface, while the latter scripts measures the network bandwidth of incoming (RX) and outgoing (TX) traffic on an interface. For these scripts to work, you do not need to install anything.

Measure Packets per Second on an Interface

#!/bin/bash
INTERVAL="1"  # update interval in seconds
if [ -z "$1" ]; then
        echo
        echo usage: $0 [network-interface]
        echo
        echo e.g. $0 eth0
        echo
        echo shows packets-per-second
        exit
fi

IF=$1

while true
do
        R1=`cat /sys/class/net/$1/statistics/rx_packets`
        T1=`cat /sys/class/net/$1/statistics/tx_packets`
        sleep $INTERVAL
        R2=`cat /sys/class/net/$1/statistics/rx_packets`
        T2=`cat /sys/class/net/$1/statistics/tx_packets`
        TXPPS=`expr $T2 - $T1`
        RXPPS=`expr $R2 - $R1`
        echo "TX $1: $TXPPS pkts/s RX $1: $RXPPS pkts/s"
done
 

Measure Network Bandwidth on an Interface

#!/bin/bash
 
INTERVAL="1" # update interval in seconds
 
if [ -z "$1" ]; then
 echo
 echo usage: $0 [network-interface]
 echo
 echo e.g. $0 eth0
 echo
 exit
fi
 
IF=$1
 
while true
do
 R1=`cat /sys/class/net/$1/statistics/rx_bytes`
 T1=`cat /sys/class/net/$1/statistics/tx_bytes`
 sleep $INTERVAL
 R2=`cat /sys/class/net/$1/statistics/rx_bytes`
 T2=`cat /sys/class/net/$1/statistics/tx_bytes`
 TBPS=`expr $T2 - $T1`
 RBPS=`expr $R2 - $R1`
 TKBPS=`expr $TBPS / 1024`
 RKBPS=`expr $RBPS / 1024`
 echo "TX $1: $TKBPS kB/s RX $1: $RKBPS kB/s"
done
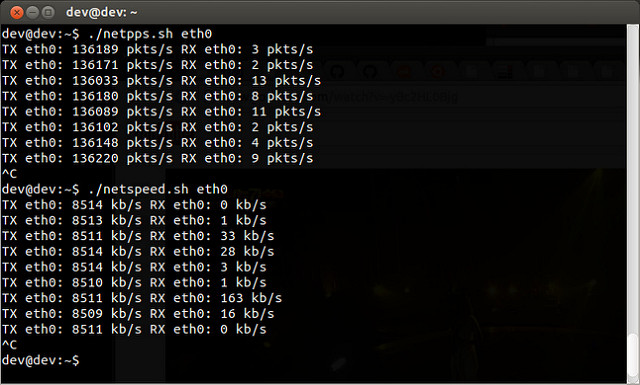
The following screenshot shows the above two scripts in action.

10700906313_cfa3cd1ed7_z

Source: Xmodulo 

Prevent DDoS with iptables

30/06/2024 Comments off

Iptables against DDoS

Using iptables to fight DDoS attacks.

After a recent conversation on the Ubuntu Forums I wanted to post an example of using iptables.

Of course there are several types of DOS attacks , in this post I will demonstrating the use if iptables to limit the traffic on port 80.

The goal is to keep your web server “responsive” to legitimate traffic, but to throttle back on excessive (potential DOS) traffic.

In this demonstration iptables is configured :

  1. The default policy is ACCEPT (to prevent lockout in the event of flushing the rules with iptables -F).
  2. “Legitimate” traffic is then allowed. In this example I am allowing traffic only on port 80.
  3. All other traffic is then blocked at the end of the INPUT chain (the final rule in the INPUT chain is to DROP all traffic).

The rules I will demonstrate are as follows:

First rule : Limit NEW traffic on port 80

sudo iptables -A INPUT -p tcp --dport 80 -m state --state NEW -m limit --limit 50/minute --limit-burst 200 -j ACCEPT

Lets break that rule down into intelligible chunks.

-p tcp --dport 80 => Specifies traffic on port 80 (Normally Apache, but as you can see here I am using nginx).

-m state NEW => This rule applies to NEW connections.

-m limit --limit 50/minute --limit-burst 200 -j ACCEPT =>This is the essence of preventing DOS.

  • “--limit-burst” is a bit confusing, but in a nutshell 200 new connections (packets really) are allowed before the limit of 50 NEW connections (packets) per minute is applied.

For a more technical review of this rule, see this netfilet page. Scroll down to a bit to the “limit” section.

Second rule – Limit established traffic

This rule applies to RELATED and ESTABLISHED all traffic on all ports, but is very liberal (and thus should not affect traffic on port 22 or DNS).

If you understood the above rule, you should understand this one as well.

sudo iptables -A INPUT -m state --state RELATED,ESTABLISHED -m limit --limit 50/second --limit-burst 50 -j ACCEPT

In summary, 50 ESTABLISHED (and/or RELATED) connections (packets really) are allowed before the limit of 50 ESTABLISHED (and/or RELATED) connections (packets) per second is applied.

Do not let that rule fool you, although it seems very open, it does put some limits on your connections.

Test it for yourself, try using the first rule with and without the second rule.

Lire la suite…

How to configure SNMPv3 in Ubuntu, CentOS and Cisco

29/06/2024 Comments off

snmpv3 ubuntuSimple Network Management Protocol (SNMP) is a widely used protocol for gathering information about what is going on within a device. For example, CPU and RAM usage, load on a server, traffic status in a network interface, and many other interesting properties of a device can be queried using SNMP.

Currently, three versions of SNMP are available: v1, v2c and v3. SNMP v1 and v2c can be easily configured, which has been discussed in a previous article. SNMPv3 adds some additional features, including authentication and encryption schemes (e.g., MD5, SHA, AES and DES). This makes SNMPv3 more secure and advisable while you run SNMP queries over the Internet.

SNMPv3 configuration is a bit different compared to SNMP v1 or v2c. The following sections explain in detail how the configuration is done.

Configure SNMPv3 on Ubuntu or Debian

The net-snmp-config tool is used for configuration. The following example creates a read-only SNMPv3 user named ‘snmpv3user‘ with password ‘snmpv3pass‘. Default authentication method MD5 and default encryption DES are used. These values can be customized as well.

root@server:~# apt-get install snmp snmpd
 root@server:~# service snmpd stop
 root@server:~# net-snmp-config --create-snmpv3-user -ro -A snmpv3pass snmpv3user
## OUTPUT ##
adding the following line to /var/lib/snmp/snmpd.conf:
   createUser snmpv3user MD5 "snmpv3pass" DES
adding the following line to /usr/share/snmp/snmpd.conf:
   rouser snmpv3user

root@server:~# service snmpd start

Lire la suite…

Categories: Réseau Tags: ,