Archive

Archives pour la catégorie ‘Logiciel’

How to resize a VirtualBox 4+ hard disk (.vdi), the easy way [quick tip]

13/01/2024 Comments off

Source: WebUpd8.org

VirtualBox 4.0 got a very cool new feature that allows you to easily resize a hard disk in just a few seconds. Previously, you had to install Gparted to do this and the procedure was quite slow.

In VirtualBox 4.0+ (see how to install VirtualBox 4.0.x in Ubuntu), to resize a VirtualBox hard disk image (.VDI) firstly locate the folder where the .vdi you want to resize is located – this should be under ~/VirtualBox VMs or ~/.VirtualBox/HardDisks. Then open a terminal, navigate to that folder (« cd /FOLDER/PATH ») and run the following command to resize the .VDI:

VBoxManage modifyhd YOUR_HARD_DISK.vdi --resize SIZE_IN_MB
Where YOUR_HARD_DISK.vdi is the VirtualBox hard disk you want to resize and SIZE_IN_MB is the new virtual hard disk size, in megabytes. For example, the following command will resize the VirtualBox hard disk called « natty.vdi » to 12000 megabytes:
VBoxManage modifyhd natty.vdi --resize 12000
That’s it! The process takes just a few seconds and you should now have a resized VirtualBox hard disk.

 

Monitor Network Connections in Mac OS X for Free with Private Eye

11/01/2024 Comments off

Source: OSXdaily

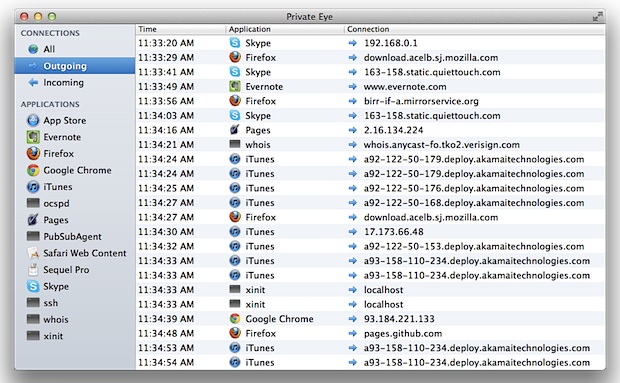
Private Eye is a free real-time network monitor app for Mac OS X that is extremely easy to use. Upon launching the app, you’ll start to see all open network connections by application and process, and you can then filter connections by app, monitor all open connections, or watch only incoming or outgoing transfer.

private-eye-network-connection-monitor-mac

Connections are reported by application, the time of the connection, and arguably the most useful, the IP address that is being connected to by the app, making it easy to see socket and routing data, letting you know exactly what app is communicating with what server or IP address, for both local and broader internet networks. If you have any interest in networking, privacy, security, or you just want to keep an eye on what apps are connecting to the internet and to where, you should download this app, but it’s also an amazingly useful tool for troubleshooting network problems and figuring out what is using the network.


Download and install Private Eye by putting it into your /Applications/ folder, then open PrivateEye to get started. The list of open network connections is easy to read, you’ll see a time stamp of the connection, the application name, and where the connection is going to by IP (or coming from, as determined by the arrow pointing left for in, or right for out).

private-eye-connections

Using the left side menu you can quickly break down connections to see them all, only show incoming transfers, outgoing connections, or display connections by specific application only. Apps are easy to identify in this list, as are daemons running in the background (like PubSubAgent), and command line processes belonging to the user are also visible (ssh, for example).

This is a simple yet powerful tool without the complexity or the learning curves related to compiling and using the command line tools lsof, watch, open_ports, or wireshark, and is therefore highly recommended for anyone who is interested in seeing this kind of information, whether it’s out of general curiosity, or to help troubleshoot and diagnose specific network activities.

Knockd : Sécuriser vos connexions

07/01/2024 Comments off
source: http://www.debianworld.org/securite.knockd

Knockd est un petit daemon qui autorise ou non une connexion à votre serveur. Pour cela il écoute les ports de votre machine et attend une séquence bien précise de connexions sur les ports que vous avez définis. Si la séquence définie est exécuté dans le bon ordre, le daemon va ouvrir le port et permettre une connexion pour un temps déterminé sur le port ssh par exemple. La séquence peut utiliser des connexions TCP ou UDP ou les deux.

Ainsi, d’un point de vue extérieur le serveur n’a aucun port d’ouverts exception faite pour les clients qui ont la séquence « magique ».

Lire la suite…

Thumbnail Generation PHP Memory Limit NextGEN Gallery

04/01/2024 Comments off

Source: Visser Labs Blog

When uploading a set of admittedly large images using NextGEN Gallery to my WordPress site I exceeded my web hosts default memory usage allocation for PHP applications. The error was:

Follow thumbnails could not created. sample.jpg (Error : Exceed Memory limit. Require : 80.65 MByte)

This issue can be resolved by increasing the memory usage allocation at a per-plugin level for PHP applications that require more grunt than others. It’s quick and easy!

  1. Open an FTP connection to your root WordPress directory
  2. Open /wp-content/plugins/nextgen-gallery/lib/gd.thumbnail.inc.php with your favourite text editor (e.g. UltraEdit, etc.)
  3. On line #168 un-comment (remove the //) from before @ini_set('memory_limit', '128M');
  4. Save and upload changes
  5. Delete image/s that failed to generate a thumbnail and re-upload using NextGEN Gallery’s standard Upload Images feature

If you find 128MB is too ‘conservative’ this can be increased again to any figure of your liking, I find 128MB appropriate for most commercial and personal usage but if you’re a HD photographer then you’re going to hit this limit very quickly… that’s it!


Categories: Logiciel Tags: , ,

How To Use Apache JMeter To Perform Load Testing on a Web Server

30/12/2023 Comments off

Introduction

In this tutorial, we will go over how to use Apache JMeter to perform basic load and stress testing on your web application environment. We will show you how to use the graphical user interface to build a test plan and to run tests against a web server.

JMeter is an open source desktop Java application that is designed to load test and measure performance. It can be used to simulate loads of various scenarios and output performance data in several ways, including CSV and XML files, and graphs. Because it is 100% Java, it is available on every OS that supports Java 6 or later.


Prerequisites

In order to follow this tutorial, you will need to have a computer that you can run JMeter on, and a web server to load test against. Do not run these tests against your production servers unless you know they can handle the load, or you may negatively impact your server’s performance.

You may adapt the tests in this tutorial to any of your own web applications. The web server that we are testing against as an example is a 1 CPU / 512 MB VPS running WordPress on a LEMP Stack, in the NYC2 DigitalOcean Datacenter. The JMeter computer is running in the DigitalOcean office in NYC (which is related to the latency of our tests).

Please note that the JMeter test results can be skewed by a variety of factors, including the system resources (CPU and RAM) available to JMeter and the network between JMeter and the web server being tested. The size of the load that JMeter can generate without skewing the results can be increased by running the tests in the non-graphical mode or by distributing the load generation to multiple JMeter servers.  Lire la suite…