Archive

Articles taggués ‘supervision’

Monitor Network Connections in Mac OS X for Free with Private Eye

11/01/2024 Comments off

Source: OSXdaily

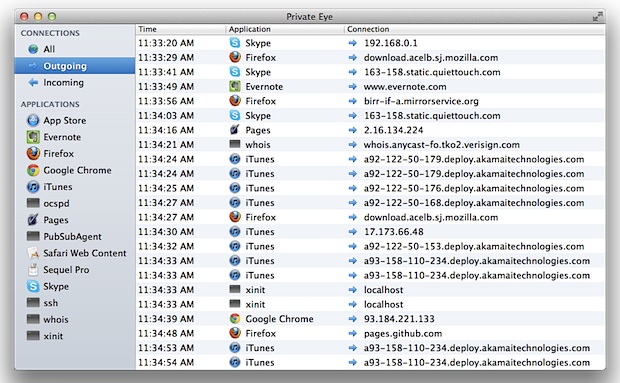
Private Eye is a free real-time network monitor app for Mac OS X that is extremely easy to use. Upon launching the app, you’ll start to see all open network connections by application and process, and you can then filter connections by app, monitor all open connections, or watch only incoming or outgoing transfer.

private-eye-network-connection-monitor-mac

Connections are reported by application, the time of the connection, and arguably the most useful, the IP address that is being connected to by the app, making it easy to see socket and routing data, letting you know exactly what app is communicating with what server or IP address, for both local and broader internet networks. If you have any interest in networking, privacy, security, or you just want to keep an eye on what apps are connecting to the internet and to where, you should download this app, but it’s also an amazingly useful tool for troubleshooting network problems and figuring out what is using the network.


Download and install Private Eye by putting it into your /Applications/ folder, then open PrivateEye to get started. The list of open network connections is easy to read, you’ll see a time stamp of the connection, the application name, and where the connection is going to by IP (or coming from, as determined by the arrow pointing left for in, or right for out).
private-eye-connections

Using the left side menu you can quickly break down connections to see them all, only show incoming transfers, outgoing connections, or display connections by specific application only. Apps are easy to identify in this list, as are daemons running in the background (like PubSubAgent), and command line processes belonging to the user are also visible (ssh, for example).

This is a simple yet powerful tool without the complexity or the learning curves related to compiling and using the command line tools lsof, watch, open_ports, or wireshark, and is therefore highly recommended for anyone who is interested in seeing this kind of information, whether it’s out of general curiosity, or to help troubleshoot and diagnose specific network activities.
How to set up web-based network traffic monitoring system on Linux

23/11/2023 Comments off

When you are tasked with monitoring network traffic on the local network, you can consider many different options to do it, depending on the scale/traffic of the local network, monitoring platforms/interface, types of backend database, etc.

ntopng is an open-source (GPLv3) network traffic analyzer which provides a web interface for real-time network traffic monitoring. It runs on multiple platforms including Linux and MacOS X. ntopng comes with a simple RMON-like agent with built-in web server capability, and uses Redis-backed key-value server to store time series statistics. You can install ntopng network traffic analyzer on any designated monitoring server connected to your network, and use a web browser to access real-time traffic reports available on the server.

In this tutorial, I will describe how to set up a web-based network traffic monitoring system on Linux by using ntopng.

Features of ntopng

  • Flow-level, protocol-level real-time analysis of local network traffic.
  • Domain, AS (Autonomous System), VLAN level statistics.
  • Geolocation of IP addresses.
  • Deep packet inspection (DPI) based service discovery (e.g., Google, Facebook).
  • Historical traffic analysis (e.g., hourly, daily, weekly, monthly, yearly).
  • Support for sFlow, NetFlow (v5/v9) and IPFIX through nProbe.
  • Network traffic matrix (who’s talking to who?).
  • IPv6 support.

Install ntopng on Linux

The official website offers binary packages for Ubuntu and CentOS. So if you use either platform, you can install these packages.

If you want to build the latest ntopng from its source, follow the instructions below. (Update: these instructions are valid for ntopng 1.0. For ntopng 1.1 and higher, see the updated instructions).

To build ntopng on Debian, Ubuntu or Linux Mint:

$ sudo apt-get install libpcap-dev libglib2.0-dev libgeoip-dev redis-server wget libxml2-dev
$ tar xzf ntopng-1.0.tar.gz -C ~
$ cd ~/ntopng-1.0/
$ ./configure
$ make geoip
$ make

In the above steps, « make geoip » will automatically download a free version of GeoIP databases with wget from maxmind.com. So make sure that your system is connected to the network.

To build ntopng on Fedora:

$ sudo yum install libpcap-devel glib2-devel GeoIP-devel libxml2-devel libxml2-devel redis wget
$ tar xzf ntopng-1.0.tar.gz -C ~
$ cd ~/ntopng-1.0/
$ ./configure
$ make geoip
$ make

To install ntopng on CentOS or RHEL, first set up EPEL repository, and then follow the same instructions as in Fedora above.

Configure ntopng on Linux

After building ntopng, create a configuration directory for ntopng, and prepare default configuration files as follows. I assume that « 192.168.1.0/24 » is the CIDR address prefix of your local network.

$ sudo mkir /etc/ntopng -p
$ sudo -e /etc/ntopng/ntopng.start
--local-networks "192.168.1.0/24"
--interface 1
$ sudo -e /etc/ntopng/ntopng.conf
-G=/var/run/ntopng.pid

Lire la suite…

Supervision de postfix via mailgraph avec le plugin check_mailstat.pl via Nagios/Centreon

28/03/2021 Comments off

Source:  l’admin sous GNU/Linux – blog libreCentreon_graph_mailstat_home


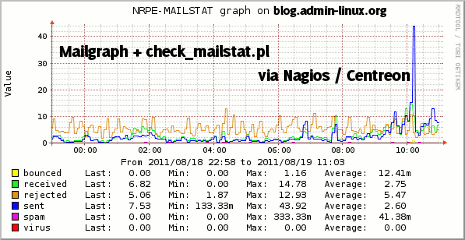
Voici une procédure permettant de contrôler l’activité d’un serveur de messagerie postfix via Nagios / Centreon.

Pour cela nous allons utiliser le plugins check_mailstat.pl avec une petite adaptation du script afin de le rendre compatible avec la génération de graphe sous Centreon.

Le plugin check_mailstat.pl va récupérer depuis des données depuis mailgraph qui permet de générer des graphes via RRDTool

Tout d’abord, il faut installer Mailgraph sur l’hôte à superviser, ici une Debian.

Installation de Mailgraph

aptitude install mailgraph

Si l’installation ne vous a pas poser les questions propres au paramétrage, lancer :

dpkg-reconfigure mailgraph

Voici les questions et réponse à fournir :

Mailgraph doit-il être lancé au démarrage ? OUI

Fichier de journalisation à utiliser par mailgraph : /var/log/mail.log (à adapter)

Faut-il compter les courriels entrants comme des courriels sortants ? NON (J’utilise Amavis, donc j’ai choisi cette option, encore une fois à adapter.

Lire la suite…