Monitor your MySql replication database
26/03/2024 Categories: Bases de données, Logiciel Tags: , , , , Comments off

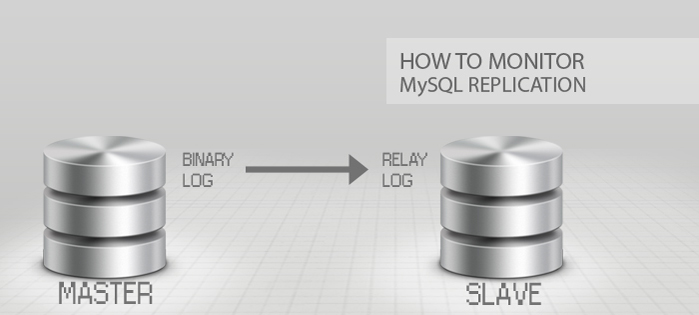
how-to-monitor-mysql-replicationYou have configured your MySql replication, next step is to perform maintenance and monitor your replication. Percona Toolkit for MySQL is a collection of advanced command-line tools to perform a variety of MySQL server and system tasks.

The Percona Toolkit allows you to amongst many tasks to verify MySQL replication integrity, efficiently archive rows, find duplicate indexes, summarize MySQL servers, analyze queries from logs and tcpdump, collect vital system information when problems occur.

To get started you need to install Percona Toolkit, I’m using Ubuntu as an OS on my servers, installing the percona toolkit was straight forward

apt-get install percona-toolkit

To get a summary of your databases use the command – pt-mysql-summary

pt-mysql-summary --u=username --p=password

Next you would want to setup a heartbeat table in your database so you can Monitor MySQL replication delay – for that you will use the pt-heartbeat command.

pt-heartbeat -D wpslavedb --create-table --ask-pass --check --master-server-id 1

You can find the manual for the options here.

pt-heartbeat measures replication lag on a MySQL or PostgreSQL server. You can use it to update a master or monitor a replica. mk-heartbeat depends only on the heartbeat record being replicated to the slave, so it works regardless of the replication mechanism. It works at any depth in the replication hierarchy; for example, it will reliably report how far a slave lags its master’s master’s master.

Start daemonized process to update test.heartbeat table on master:

  pt-heartbeat -D wpslavedb --update -h master-server --daemonize --ask-pass

Monitor replication lag on slave:

  pt-heartbeat -D wpslavedb --monitor -h slave-server --ask-pass
  pt-heartbeat -D wpslavedb --monitor -h slave-server --dbi-driver Pg --ask-pass

Check slave lag once and exit (using optional DSN to specify slave host):

  pt-heartbeat -D wpslavedb --check h=slave-server --ask-pass

If the replication hierarchy is “master -> slave1 -> slave2” with corresponding server IDs 1, 2 and 3, you can:

  pt-heartbeat --daemonize -D wpslavedb --update -h master --ask-pass
  pt-heartbeat --daemonize -D wpslavedb --update -h slave1 --ask-pass

Then check (or monitor) the replication delay from master to slave2:

  pt-heartbeat -D wpslavedb --master-server-id 1 --check slave2 --ask-pass

Or check the replication delay from slave1 to slave2:

  pt-heartbeat -D wpslavedb --master-server-id 2 --check slave2 --ask-pass

if you developing and writing SQL statements, this command is very useful pt-query-digest – Analyze MySQL queries from logs, processlist, and tcpdump

  pt-query-digest slow.log    // requires you to have slow query logged enabled

There are other tools Percona Toolkit, these that I shown is what I find useful for my monitoring and maintenance.

If you want to find out the best MySQL configuration for your application, you can head over to Percona’s website they have a MySql wizards.

Source: torbjornzetterlund.com
Un cluster DRBD / MySQL avec Heartbeat sur Debian 7

25/03/2024 Categories: Bases de données, Système Tags: , , , , Comments off

Source: denisrosenkranz.com

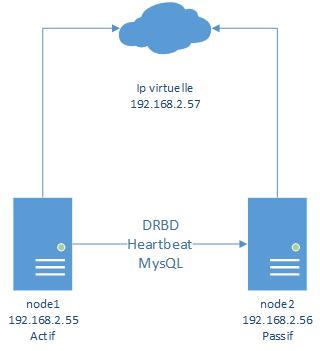
Nous avons vu précédement comment mettre un place un Cluster Apache actif/passif avec DRBD et HeartBeat. Dans ce tutoriel nous allons voir comment faire la même chose mais avec MySQL.

La configuration de DRBD et de Heartbeat est la même que pour le tutoriel précédent.

Voilà ce que nous allons mettre en place

DRBDMySQL

Donc pour faire ce tutoriel suivez le tutoriel suivant jusqu’a « Installation d’apache« :

Un cluster DRBD/Apache avec Heartbeat sur Debian 7

Lire la suite…

How to Change Location of IPTables Logs

25/03/2024 Categories: Réseau, Système Tags: , , , Comments off

Logs are a very important aspect of any firewall. In IPTables, linux provides such functionality as logging, but by default the logs go to a file /var/log/syslog or /var/log/messages . Sometimes it can be hard to find the information you need, as logs from the entire system are also found there.

If you want to change the file where IPTables logs into, you must configure IPTables rules to display the log prefix, next thing is configure RsysLog to get this prefix and send this to a custom log file that contains only iptables log information.

  • Check if you have RsysLog installed and running
root@dbsysnet:/home/olivier# dpkg -l | grep rsyslog
ii  rsyslog                               8.32.0-1ubuntu4                                 amd64        reliable system and kernel logging daemon
Jul 20 17:59:56 dbsysnet systemd[1]: Starting System Logging Service...
Jul 20 17:59:56  systemd[1]: Started System Logging Service.
Jul 20 17:59:56  rsyslogd[813]: warning: ~ action is deprecated, consider using the 'stop' statement instead [v8.32.0 try http://www.
Jul 20 17:59:56  rsyslogd[813]: imuxsock: Acquired UNIX socket '/run/systemd/journal/syslog' (fd 3) from systemd.  [v8.32.0]
Jul 20 17:59:56  rsyslogd[813]: rsyslogd's groupid changed to 106
Jul 20 17:59:56  rsyslogd[813]: rsyslogd's userid changed to 102
Jul 20 17:59:56  rsyslogd[813]:  [origin software="rsyslogd" swVersion="8.32.0" x-pid="813" x-info="http://www.rsyslog.com"] start
  • Configure your IPTABLES rules with --log-prefix
# iptables -A INPUT -p tcp --dport 22 --syn -j LOG --log-prefix "[IPTABLES]: "
  • Create configuration file for RsysLog
# touch /etc/rsyslog.d/10-iptables.conf
  • Open this file and paste below configuration and tne save file
:msg, contains, "[IPTABLES]: " -/var/log/firewall.log
& ~

Explanation:

First line check data log for word [IPTABLES] : and if the word is found it will be sent to the file /var/log/firewall.log

Second line is responsible for stopping the log processing and sending it to the standard location in this case /var/log/syslog or /var/log/messages

  • Restart RsysLog service
root@:/home/olivier# systemctl restart rsyslog

Lire la suite…

Categories: Réseau, Système Tags: , , ,

Un cluster DRBD / Apache avec Heartbeat sur Debian 7

24/03/2024 Categories: Logiciel, Système Tags: , , Comments off

C’est quoi Heartbeat?

drbd apache debianHeartbeat est un logiciel de surveillance de la disponibilité des programmes, pour les systèmes d’exploitation Linux, FreeBSD, OpenBSD, Solaris et MacOS X. Il est distribué sous licence GPL.

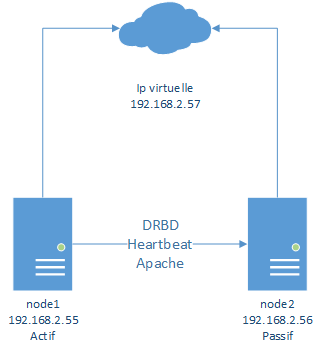
Heartbeat écoute les battements de cœur – des signaux émis par les services d’une grappe de serveurs lorsqu’ils sont opérationnels. Lorsque qu’un serveur devient défaillant, Heartbeat le detecte (puisqu’il n’entend plus ses battements de coeurs) et bascule les services surveillés sur un autre serveur. Pour que cela soit transparent pour les utilisateurs, Heartbeat met en place une IP virtuelle unique qui est balancée entre les deux serveurs.

Voici ce que nous allons mettre en place

Schéma

Mise en place de la solution

Pour ce tuto, nous allons partir du Cluster DRBD que nous avons mis en place dans le tutoriel précédent:

DRDB sur Debian 6

Lire la suite…

Categories: Logiciel, Système Tags: , ,

DRBD sur Debian 6

24/03/2024 Categories: Système Tags: , , Comments off

Source: denisrosenkranz.com

Qu’est-ce que DRBD?

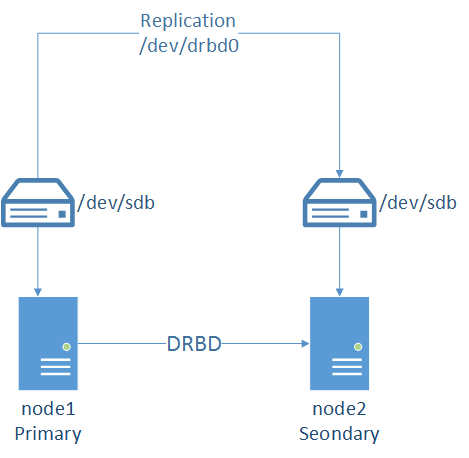
DRBD pour Distributed Replicated Block Device est comparable à un RAID 1 mais en réseau, c’est à dire que deux disques, partitions ou même un LVM peuvent être repliqué d’un disque à un autre via un réseau ethernet ou fibre optique.
Cela permet donc d’assurer la disponibilité de vos données en cas de crash complet d’une machine. Ce que ne permet pas de faire un RAID classique.

DRBDDiag

Pour ce tuto nous allons donc utiliser deux machines virtuelles sous Debian 6.

Lire la suite…

Categories: Système Tags: , ,