Ce document rappelle les commandes et les options les plus utilisées par l’administrateur d’un système Linux. Il s’agit surtout de commandes assez générales, dont tout administrateur aura besoin un jour ou l’autre. Les commandes pour l’utilisateur courant se trouvent dans un autre aide-mémoire. Pour plus d’informations, on consultera les pages de manuel ou les publications du Linux Documentation Project
Une version prête à l’impression recto-verso est disponible pour conserver cet aide-mémoire dans un format facile à ranger dans un tiroir ou sous un clavier.
Informations système
uname – Identification du système.
-a : toutes les informations.
dmesg – Messages du noyau (et ceux du boot).
uptime – Durée et charge du système.
free – Occupation de la mémoire.
vmstat – Détails sur l’utilisation de la mémoire.
ipcs – Utilisation des ressources IPC System V.
ipcrm – Suppression de ressources IPC System V.
ldconfig – Valider les bibliothèques dynamiques.
init – Changement de niveau de fonctionnement :
0 : arrêt.
1 : mono-utilisateur,
3 : multi-utilisateurs mode texte,
5 : multi-utilisateurs mode graphique,
6 : redémarrer.
Utilisateurs
useradd – Ajout d’un utilisateur :
useradd -m -p "" linus
crée un compte linus, avec répertoire personnel et mot de passe vide.
SSH est l’acronyme de Secure SHell. Il s’agit historiquement du remplaçant de Telnet. Telnet est l’outil utilisé pour dialoguer simplement avec un serveur. Sa force : il peut se connecter à n’importe quoi ou presque. Ainsi, un fou utilisant telnet peut envoyer des emails (protocole SMTP), lire des pages Web (protocole HTTP), remettre sa montre à l’heure (protocole NTP), etc… Son inconvénient majeur : toutes les informations circulent en clair sur le réseau, mots de passes compris. A une époque, telnet était utilisé pour ouvrir une session à distance sur un serveur… imaginez le cauchemard. SSH est un outil dédié à l’ouverture de sessions à distances via une connexion sécurisée. Pour faire simple, SSH est à telnet ce que HTTPS est à HTTP : une version chiffrée et sécurisée. Cet article présente certaines des subtilités de SSH. Lire la suite…
Need to monitor Linux server performance? Try these built-in command and a few add-on tools. Most Linux distributions are equipped with tons of monitoring. These tools provide metrics which can be used to get information about system activities. You can use these tools to find the possible causes of a performance problem. The commands discussed below are some of the most basic commands when it comes to system analysis and debugging server issues such as:
Finding out bottlenecks.
Disk (storage) bottlenecks.
CPU and memory bottlenecks.
Network bottlenecks.
#1: top – Process Activity Command
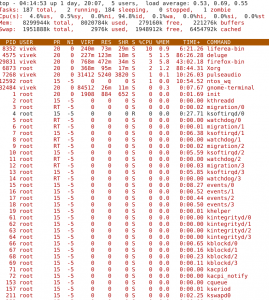
The top program provides a dynamic real-time view of a running system i.e. actual process activity. By default, it displays the most CPU-intensive tasks running on the server and updates the list every five seconds.
Commonly Used Hot Keys
The top command provides several useful hot keys:
Hot Key
Usage
t
Displays summary information off and on.
m
Displays memory information off and on.
A
Sorts the display by top consumers of various system resources. Useful for quick identification of performance-hungry tasks on a system.
f
Enters an interactive configuration screen for top. Helpful for setting up top for a specific task.
o
Enables you to interactively select the ordering within top.
Both netfilter and pf provides rate-limit option to perform simple throttling on incoming connections on port # 22.
Iptables Example
The following example will drop incoming connections which make more than 5 connection attempts upon port 22 within 60 seconds:
#!/bin/bash
inet_if=eth1
ssh_port=22
$IPT -I INPUT -p tcp --dport ${ssh_port} -i ${inet_if} -m state --state NEW -m recent  --set
$IPT -I INPUT -p tcp --dport ${ssh_port} -i ${inet_if} -m state --state NEW -m recent  --update --seconds 60 --hitcount 5 -j DROP
Call above script from your iptables scripts. Another config option:
$IPT -A INPUT  -i ${inet_if} -p tcp --dport ${ssh_port} -m state --state NEW -m limit --limit 3/min --limit-burst 3 -j ACCEPT
$IPT -A INPUT  -i ${inet_if} -p tcp --dport ${ssh_port} -m state --state ESTABLISHED -j ACCEPT
$IPT -A OUTPUT -o ${inet_if} -p tcp --sport ${ssh_port} -m state --state ESTABLISHED -j ACCEPT
# another one line example
# $IPT -A INPUT -i ${inet_if} -m state --state NEW,ESTABLISHED,RELATED -p tcp --dport 22 -m limit --limit 5/minute --limit-burst 5-j ACCEPT
See iptables man page for more details.
*BSD PF Example
The following will limits the maximum number of connections per source to 20 and rate limit the number of connections to 15 in a 5 second span. If anyone breaks our rules add them to our abusive_ips table and block them for making any further connections. Finally, flush keyword kills all states created by the matching rule which originate from the host which exceeds these limits.
sshd_server_ip="202.54.1.5"
table <abusive_ips> persist
block in quick from <abusive_ips>
pass in on $ext_if proto tcp to $sshd_server_ip port ssh flags S/SA keep state (max-src-conn 20, max-src-conn-rate 15/5, overload <abusive_ips> flush)
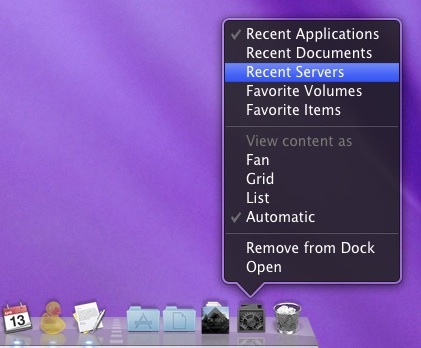
You can add a Recent Items menu to the Mac OS X Dock by using a defaults write command. The default is set to “Recent Applications” but once the Dock item exists you can adjust it to feature other recent items too.
That needs to all be on a single line, so if you copy and paste it make sure the command is one string.
You will then need to kill the Dock:
killall Dock
Now right-click on the newly appeared Recent Applications Dock item and you can change it to be Recent Applications, Recent Documents, Recent Servers, Favorite Volumes, or Favorite Items.
If you want to remove the Recent Items menu, just drag it out of your Dock.