You may want to block unwanted IP addresses on your Linux box under various circumstances. For example, as an end user you may want to protect yourself from known spyware or tracker IP addresses. Or when you are running P2P software, you may want to filter out connections from networks associated with anti-P2P activity. If you are a sysadmin, you may want to ban access from spam IP addresses to your production mail server. Or you may wish to block web server access from certain countries for some reason. In many cases, however, your IP address block list can grow quickly to tens of thousands of IP addresses or IP address blocks. How can you deal with it?
Problems of Netfilter/IPtables
In Linux, banning an IP address can be done very easily with netfilter/iptables framework:
$ sudo iptables -A INPUT -s 1.1.1.1 -p TCP -j DROP
If you want to ban a whole IP address block, you can also do it as easily:
$ sudo iptables -A INPUT -s 1.1.2.0/24 -p TCP -j DROP
However, what if you have 1,000 independent IP addresses with no common CIDR prefix that you want to ban? You would have 1,000 iptables rules! Clearly this does not scale.
$ sudo iptables -A INPUT -s 1.1.1.1 -p TCP -j DROP
$ sudo iptables -A INPUT -s 2.2.2.2 -p TCP -j DROP
$ sudo iptables -A INPUT -s 3.3.3.3 -p TCP -j DROP
 . . . .
What are IP Sets?
That is when IP sets come in handy. IP sets are a kernel feature which allows multiple (independent) IP addresses, MAC addresses or even port numbers to be encoded and stored efficiently within bitmap/hash kernel data structures. Once an IP set is created, you can create an iptables rule which matches against the set.
You should immediately see the benefit of using IP sets, which is that you can match against multiple IP addresses in an IP set by using a singleiptables rule! You can construct IP sets using combinations of multiple IP addresses and port numbers, and can dynamically update iptables rules with IP sets without any performance impact.
Fail2ban: An Apache HTTP server in production environments can be under attack in various different ways. Attackers may attempt to gain access to unauthorized or forbidden directories by using brute-force attacks or executing evil scripts. Some malicious bots may scan your websites for any security vulnerability, or collect email addresses or web forms to send spams to.
Apache HTTP server comes with comprehensive logging capabilities capturing various abnormal events indicative of such attacks. However, it is still non-trivial to systematically parse detailed Apache logs and react to potential attacks quickly (e.g., ban/unban offending IP addresses) as they are perpetrated in the wild. That is when fail2ban comes to the rescue, making a sysadmin‘s life easier.
fail2ban is an open-source intrusion prevention tool which detects various attacks based on system logs and automatically initiates prevention actions e.g., banning IP addresses with iptables, blocking connections via /etc/hosts.deny, or notifying the events via emails. fail2ban comes with a set of predefined « jails » which use application-specific log filters to detect common attacks. You can also write custom jails to deter any specific attack on an arbitrary application.
In this tutorial, I am going to demonstrate how you can configure fail2ban to protect your Apache HTTP server. I assume that you have Apache HTTP server and fail2ban already installed. Refer to another tutorial for fail2ban installation.
What is a Fail2ban Jail
Let me go over more detail on fail2ban jails. A jail defines an application-specific policy under which fail2ban triggers an action to protect a given application. fail2ban comes with several jails pre-defined in /etc/fail2ban/jail.conf, for popular applications such as Apache, Dovecot, Lighttpd, MySQL, Postfix, SSH, etc. Each jail relies on application-specific log filters (found in /etc/fail2ban/fileter.d) to detect common attacks. Let’s check out one example jail: SSH jail.
This SSH jail configuration is defined with several parameters:
[ssh]: the name of a jail with square brackets.
enabled: whether the jail is activated or not.
port: a port number to protect (either numeric number of well-known name).
filter: a log parsing rule to detect attacks with.
logpath: a log file to examine.
maxretry: maximum number of failures before banning.
banaction: a banning action.
Any parameter defined in a jail configuration will override a corresponding fail2ban-wide default parameter. Conversely, any parameter missing will be assgined a default value defined in [DEFAULT] section.
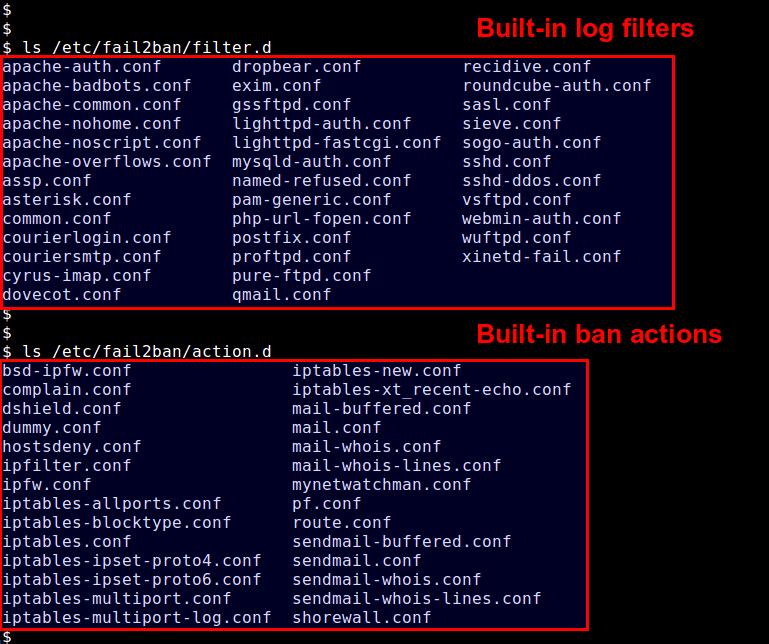
Predefined log filters are found in /etc/fail2ban/filter.d, and available actions are in /etc/fail2ban/action.d.
If you want to overwrite fail2ban defaults or define any custom jail, you can do so by creating /etc/fail2ban/jail.local file. In this tutorial, I am going to use /etc/fail2ban/jail.local.
In an operating system, logs are all about keeping track of events, be it critical system errors, resource usage warnings, transaction history, application status, or user activities. These logs, which are stored as (text or binary) files in the system, are useful for system auditing, debugging and maintenance. However, with so many different system entities generating log files, and even at growing rate, the challenge as a system admin is to how to « consume » these log files effectively.
That’s when log monitoring tools come into the picture, which streamline the often laborious process of collecting, parsing and analyzing log files, as well as alerting system admins for any interesting events. These tools are designed from ground up focused on log monitoring, so they offer many attractive features, such as scalable log aggregation and filtering, human-readable display, event correlation, visual or email notification, flexible log retention policy, and so on.
In this post, I am going to introduce a list of popular open-source log monitoring software for Linux, ranging from simple log file viewers to full-blown log monitoring frameworks.
Log Aggregation and Filtering
Log monitoring would not be possible without efficient and scalable mechanisms to collect and pre-process log files. Tools in this category focus on shipping, collecting, filtering, indexing and storing log files, so that they can be further analyzed and visualized in subsequent monitoring pipelines.
1. rsyslog: an open-source log collector server which can filter and consolidate log data (based on syslog protocol) from different hosts and devices in the network. rsyslog can be configured as a server or a client, where the former plays the role of a log collector and the latter runs as a log sender.
2. syslog-ng: another open-source implementation of the syslog protocol with more advanced and user-friendly features such as content-based filtering, easier-to-understand config format, and real-time event correlation.
3. systemd journal: systemd journal can be configured for remote journal logging, where locally logged events are forwarded to a remote server over HTTP. In this setup, systemd-journal-upload on a client host serializes and forwards journal messages to systemd-journal-remote running on a remote collector server.
4. logstash: an open-source tool that collects, parses, and stores log files for offline search and analysis. logstash can run in various pipelines due to many plugins supporting different input/output interfaces, decoding/encoding, and filtering rules. Input plugins allows logstash to gather log files from different sources and protocols (e.g., files, S3, RabbitMQ, syslog, collectd, TCP/UDP sockets). Filter/codec plugins are used to parse, convert, modify and add metadata to log files. Output plugins pass processed log files to various target storages (e.g., file, Google cloud storage, Nagios, S3, Zabbix).
5. collectd: a daemon service which gathers various system-level statistics, and stores them for historical analysis or real-time graphing. Similar to logstash, collectd is an extensible architecture, where you can enable various input/output plugins to change its collection behaviors. For log collection, collectd can leverage LogFile and Network plugins to aggregate remote log files.
6. Logster: an open-source utility for parsing log files for any interesting data, and aggregating extracted data into metrics for subsequent reporting and graphing pipelines.
7. Fluentd: a unified log aggregation layer which allows in-stream processing for a variety of streaming data and log files. It comes with a huge plugin ecosystem with more than 300 plugins to support various input sources and output interfaces.
8. Nxlog: a unified log collector and forwarder which supports a variety of log sources, formats and protocols. Advanced features include multi-threaded log collection and processing, message buffering and prioritization, built-in log rotation, and TLS/SSL transport.
9. Scribe:: a scalable log collector server developed by Facebook. Scribe can aggregate log data which is streamed in real time from a large number of clients. It uses Apache Thrift for protocol encoding, so its interface is compatible with pretty much any languages. While a proven solution, Scribe is not something you can deploy quickly as a turnkey. Also, note that Scribe is no longer updated and maintained.
10. Flume: a highly scalable and reliable service to transport and collect large volumes of streaming log data from any clients, and store them in backend storage such as Apache Hadoops’ HDFS.
Like for every thing, there are plenty of commands to check information about the hardware of your linux system. Some commands report only specific hardware components like cpu or memory while the rest cover multiple hardware units.
This post takes a quick look at some of the most commonly used commands to check information and configuration details about various hardware peripherals and devices. The list includes lscpu, hwinfo, lshw, dmidecode, lspci etc.
1. lscpu
The lscpu command reports information about the cpu and processing units. It does not have any further options or functionality.
$ lscpu
Architecture:          x86_64
CPU op-mode(s):        32-bit, 64-bit
Byte Order:            Little Endian
CPU(s):                4
On-line CPU(s) list:   0-3
Thread(s) per core:    1
Core(s) per socket:    4
Socket(s):             1
NUMA node(s):          1
Vendor ID:             GenuineIntel
CPU family:            6
Model:                 23
Stepping:              10
CPU MHz:               1998.000
BogoMIPS:              5302.48
Virtualization:        VT-x
L1d cache:             32K
L1i cache:             32K
L2 cache:              2048K
NUMA node0 CPU(s):     0-3
2. lshw – List Hardware
A general purpose utility, that reports detailed and brief information about multiple different hardware units such as cpu, memory, disk, usb controllers, network adapters etc. Lshw extracts the information from different /proc files.
$ sudo lshw -short

H/W path        Device      Class       Description
===================================================
                            system      ()
/0                          bus         DG35EC
/0/0                        processor   Intel(R) Core(TM)2 Quad CPU    Q8400  @ 2.66GHz
/0/0/1                      memory      2MiB L2 cache
/0/0/3                      memory      32KiB L1 cache
/0/2                        memory      32KiB L1 cache
/0/4                        memory      64KiB BIOS
/0/14                       memory      8GiB System Memory
/0/14/0                     memory      2GiB DIMM DDR2 Synchronous 667 MHz (1.5 ns)
/0/14/1                     memory      2GiB DIMM DDR2 Synchronous 667 MHz (1.5 ns)
/0/14/2                     memory      2GiB DIMM DDR2 Synchronous 667 MHz (1.5 ns)
/0/14/3                     memory      2GiB DIMM DDR2 Synchronous 667 MHz (1.5 ns)
/0/100                      bridge      82G35 Express DRAM Controller
/0/100/2                    display     82G35 Express Integrated Graphics Controller
/0/100/2.1                  display     82G35 Express Integrated Graphics Controller
/0/100/19       eth0        network     82566DC Gigabit Network Connection
/0/100/1a                   bus         82801H (ICH8 Family) USB UHCI Controller #4
/0/100/1a.1                 bus         82801H (ICH8 Family) USB UHCI Controller #5
/0/100/1a.7                 bus         82801H (ICH8 Family) USB2 EHCI Controller #2
/0/100/1b                   multimedia  82801H (ICH8 Family) HD Audio Controller
/0/100/1c                   bridge      82801H (ICH8 Family) PCI Express Port 1
/0/100/1c.1                 bridge      82801H (ICH8 Family) PCI Express Port 2
/0/100/1c.2                 bridge      82801H (ICH8 Family) PCI Express Port 3
/0/100/1c.2/0               storage     JMB368 IDE controller
/0/100/1d                   bus         82801H (ICH8 Family) USB UHCI Controller #1
/0/100/1d.1                 bus         82801H (ICH8 Family) USB UHCI Controller #2
/0/100/1d.2                 bus         82801H (ICH8 Family) USB UHCI Controller #3
/0/100/1d.7                 bus         82801H (ICH8 Family) USB2 EHCI Controller #1
/0/100/1e                   bridge      82801 PCI Bridge
/0/100/1e/5                 bus         FW322/323 [TrueFire] 1394a Controller
/0/100/1f                   bridge      82801HB/HR (ICH8/R) LPC Interface Controller
/0/100/1f.2                 storage     82801H (ICH8 Family) 4 port SATA Controller [IDE mode]
/0/100/1f.3                 bus         82801H (ICH8 Family) SMBus Controller
/0/100/1f.5                 storage     82801HR/HO/HH (ICH8R/DO/DH) 2 port SATA Controller [IDE m
/0/1            scsi3       storage
/0/1/0.0.0      /dev/sda    disk        500GB ST3500418AS
/0/1/0.0.0/1    /dev/sda1   volume      70GiB Windows NTFS volume
/0/1/0.0.0/2    /dev/sda2   volume      395GiB Extended partition
/0/1/0.0.0/2/5  /dev/sda5   volume      97GiB HPFS/NTFS partition
/0/1/0.0.0/2/6  /dev/sda6   volume      97GiB Linux filesystem partition
/0/1/0.0.0/2/7  /dev/sda7   volume      1952MiB Linux swap / Solaris partition
/0/1/0.0.0/2/8  /dev/sda8   volume      198GiB Linux filesystem partition
/0/3            scsi4       storage
/0/3/0.0.0      /dev/cdrom  disk        DVD RW DRU-190A
Check out the following post to learn more about lshw
“inotify”, Remplaçant de “dnotify”, est une technologie, intégrée au noyau Linux (>=2.6.13) , destinée à notifier les événements, modifications, accès, etc, effectués sur le contenu d’un système de fichiers en ce basant sur le contrôle des “inodes” (structures de données contenant des informations sur les fichiers d’un systèmes de fichiers).
« incron« , Pour « INotify CRON », permet d’exploiter les informations « d’inotify » afin d’effectuer une action, commande(s), scripts, etc, en cas de modifications de fichiers ou de répertoires donnés.
Installation de inotify
« inotify » Est intégré au noyau et est activé dans les kernels fournis par les distributions.