When you are experiencing slow Internet access, you may want to test the Internet speed of your upstream ISP (often called « last mile » in the residential broadband networks) as part of troubleshooting. For that matter, Speedtest.net is probably the most widely used broadband speed testing website.
Underneath it, Speedtest.net loads JavaScript code in your web browser, which then automatically detects the closest Speedtest.net server from you, and measures download/upload speed by sending HTTP GET and POST requests to the server.
However, if you are trying to check Internet speed from a remote headless server, VPS or an otherwise desktop-less system, Speedtest.net’s Flash-based user-friendly interface would be no good. For those of you, there is a command-line interface (CLI) version of Speedtest.net, known as speedtest-cli. Here I will demonstrate how to use speedtest-cli to check Internet speed from the command line in Linux.
Install speedtest-cli on Linux
speedtest-cli is a simple CLI client written in Python for measuring bidirectional Internet bandwidth by using Speedtest.net infrastructure. It works with Python 2.4-3.4. Installing the latest speedtest-cli is nothing more than downloading the Python script.
It is straightforward to check your Internet speed with speedtest-cli. Running speedtest-cli command without any argument gets its job done.
$ speedtest-cli
This will automatically discover the closest Speedtest.net server (in terms of geographic distance), and report download and upload speed measured from the server.
If you want to share the speed test result, you can use « --share » option, which will allow you to share speed test result with others in an image format via Speedtest.net.
The following is a sample image automatically generated and uploaded to Speedtest.net by speedtest-cli.
If you want to find out where a given IP address is physically located on earth, there are quite a few online GeoIP lookup services you can try (e.g. geoiptool.com). These online services are mostly powered by freely available GeoIP databases such as those from MaxMind. Besides using such web-based services, there are different ways to query the GeoIP databases, notably via the Linux command line.
In this tutorial, I am going to describe how to geolocate an IP address from the command line in Linux.
Method One
The first method is to use geoiplookup tool which is a command-line client for MaxMind’s GeoIP databases. geoiplookup allows you to look up the geography or network information of an IP address (or hostname). You can install the tool (along with the free GeoIP database used by the tool) as follows.
To install geoiplookup on Debian, Ubuntu or Linux Mint:
$ sudo apt-get install geoip-bin
To install geoiplookup on Fedora:
$ sudo yum install geoip
To install geoiplookup on CentOS, first enable EPEL repository, and then use yum command:
$ sudo yum install geoip
The default installation of geoiplookup comes with GeoIP.dat database file which is located in /usr/share/GeoIP. With this database, you can look up the country information only.
$ geoiplookup 23.66.166.151
GeoIP Country Edition: US, United States
You can download additional GeoIP databases from MaxMind, which give you more detailed information about IP addresses beyond country info. You can also download more up-to-date GeoIP.dat from the site. This is recommended because GeoIP.dat may have already been outdated by the time you install it from Linux repositories. The GeoIP databases available on MaxMind website are updated every month.
To install additional GeoIP databases from MaxMind, do the following. You may want to set up a monthly cronjob to automate this process.
Now if you re-run geoiplookup, you will see the additional AS number information of an IP address. This basically tells you which administrative domain the IP address belongs to.
$ geoiplookup 128.112.119.209
GeoIP Country Edition: US, United States
GeoIP ASNum Edition: AS88 Princeton University
When run without any parameter, geoiplookup tool automatically uses GeoIP.dat and GeoIPASNum.dat only, but not use GeoLiteCity.dat. The latter can give you city-level information.
To obtain city-level geolocation information, explicitly tell geoiplookup to use GeoLiteCity.dat database.
The output includes state, city, zipcode, latitude and longitude. The accuracy of the inferred location varies across different countries and networks. For example, the geolocation result tends to be more accurate for broadband IP addresses, but not as accurate for mobile networks.
Method Two
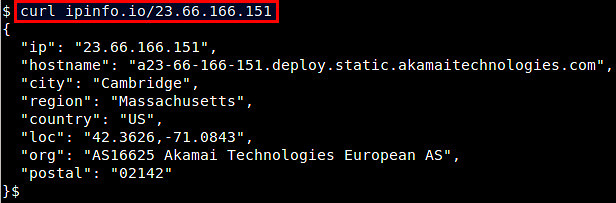
If you want to avoid the hassle of installing and updating GeoIP databases, you can try ipinfo.io online service. Unlike other services, ipinfo.io provides JSON-based geolocation API, so you can easily look up geolocation from the command line, using tools like curl.
$ curl ipinfo.io/23.66.166.151
Note that the access to their API is rate-limited at 1,000 API requests per day.
An important aspect of any firewall are the log files. Iptables on Linux provides logging functionality, however by default, it will get outputted to the /var/log/messages log file. This can clutter things up, and make it hard to check the logs.
If you want to change the file that IPTables logs to, you need to set up your iptables rules to output a log prefix. Rsyslog will then be configured to pick up this prefix, and output the information to a custom log file, containing just the iptables log information. Install rsyslog if it is not already installed.
When it comes to monitoring a Linux server, there are more than enough options to choose from. While there are many production-quality monitoring solutions (e.g., Nagios, Zabbix, Zenoss), boasting of fancy UI, monitoring scalability, comprehensive reporting capabilities, etc., these solutions are probably an overkill for most of us end users. If all you need is to check the basic status (e.g., CPU load, memory usage, active processes, disk usage) of a remote Linux server or desktop, consider linux-dash.
linux-dash is a web-based lightweight monitoring dashboard for Linux machines, which can display, in real-time, various system properties, such as CPU load, RAM usage, disk usage, Internet speed, network connections, RX/TX bandwidth, logged-in users, running processes etc. linux-dash does not come with any backend database for storing long-term statistics. Simply drop in linux-dash app in an existing web server (e.g., Apache, Nginx), and you are good to go. It is a quick and easy way to set up remote monitoring for personal projects.
In this tutorial, I am going to describe how to set up linux-dash in Nginx web server on Linux. Nginx is preferred over Apache web server due to its lightweight engine.
Configure php-fpm by editing /etc/php5/fpm/pool.d/www.conf. Make sure to edit « user« , « group » and « listen » directives as shown below. You can keep the rest of the configuration unchanged.
$ sudo vi /etc/php5/fpm/pool.d/www.conf

. . .
user = www-data
group = www-data
listen = /var/run/php5-fpm.sock
. . .
Suppose you want to sniff live HTTP web traffic (i.e., HTTP requests and responses) on the wire for some reason. For example, you may be testing experimental features of a web server. Or you may be debugging a web application or a RESTful service. Or you may be trying to troubleshoot PAC (proxy auto config) or check for any malware files surreptitiously downloaded from a website. Whatever the reason is, there are cases where HTTP traffic sniffing is helpful, for system admins, developers, or even end users.
While packet sniffing tools such as tcpdump are popularly used for live packet dump, you need to set up proper filtering to capture only HTTP traffic, and even then, their raw output typically cannot be interpreted at the HTTP protocol level so easily. Real-time web server log parsers such as ngxtopprovide human-readable real-time web traffic traces, but only applicable with a full access to live web server logs.
What will be nice is to have tcpdump-like sniffing tool, but targeting HTTP traffic only. In fact, httpryis extactly that: HTTP packet sniffing tool. httpry captures live HTTP packets on the wire, and displays their content at the HTTP protocol level in a human-readable format. In this tutorial, let’s see how we can sniff HTTP traffic with httpry.
Install httpry on Linux
On Debian-based systems (Ubuntu or Linux Mint), httpry is not available in base repositories. So build it from the source:
$ sudo apt-get install gcc make git libpcap0.8-dev
$ git clone https://github.com/jbittel/httpry.git
$ cd httpry
$ make
$ sudo make install
On Fedora, CentOS or RHEL, you can install httpry with yum as follows. On CentOS/RHEL, enableEPEL repo before running yum.
$ sudo yum install httpry
If you still want to build httpry from the source on RPM-based systems, you can easily do that by:
$ sudo yum install gcc make git libpcap-devel
$ git clone https://github.com/jbittel/httpry.git
$ cd httpry
$ make
$ sudo make install
Basic Usage of httpry
The basic use case of httpry is as follows.
$ sudo httpry -i <network-interface>
httpry then listens on a specified network interface, and displays captured HTTP requests/responses in real time.
In most cases, however, you will be swamped with the fast scrolling output as packets are coming in and out. So you want to save captured HTTP packets for offline analysis. For that, use either ‘-b’ or ‘-o’ options. The ‘-b’ option allows you to save raw HTTP packets into a binary file as is, which then can be replayed with httpry later. On the other hand, ‘-o’ option saves human-readable output ofhttpry into a text file.
To save raw HTTP packets into a binary file:
$ sudo httpry -i eth0 -b output.dump
To replay saved HTTP packets:
$ httpry -r output.dump
Note that when you read a dump file with ‘-r’ option, you don’t need root privilege.
To save httpry‘s output to a text file:
$ sudo httpry -i eth0 -o output.txt
Advanced Usage of httpry
If you want to monitor only specific HTTP methods (e.g., GET, POST, PUT, HEAD, CONNECT, etc), use ‘-m’ option:
$ sudo httpry -i eth0 -m get,head
If you downloaded httpry‘s source code, you will notice that the source code comes with a collection of Perl scripts which aid in analyzing httpry‘s output. These scripts are found in httpry/scripts/plugins directory. If you want to write a custom parser for httpry‘s output, these scripts can be good examples to start from. Some of their capabilities are:
hostnames: Display a list of unique host names with counts.
find_proxies: Detect web proxies.
search_terms: Find and count search terms entered in search services.
content_analysis: Find URIs which contain specific keywords.
xml_output: Convert output into XML format.
log_summary: Generate a summary of log.
db_dump: Dump log file data into a MySQL database.
Before using these scripts, first run httpry with ‘-o’ option for some time. Once you obtained the output file, run the scripts on it at once by using this command:
$ cd httpry/scripts
$ perl parse_log.pl -d ./plugins <httpry-output-file>
You may encounter warnings with several plugins. For example, db_dump plugin may fail if you haven’t set up a MySQL database with DBI interface. If a plugin fails to initialize, it will automatically be disabled. So you can ignore those warnings.
After parse_log.pl is completed, you will see a number of analysis results (*.txt/xml) in httpry/scripts directory. For example, log_summary.txt looks like the following.
To conclude, httpry can be a life saver if you are in a situation where you need to interpret live HTTP packets. That might not be so common for average Linux users, but it never hurts to be prepared. What do you think of this tool?