Tmux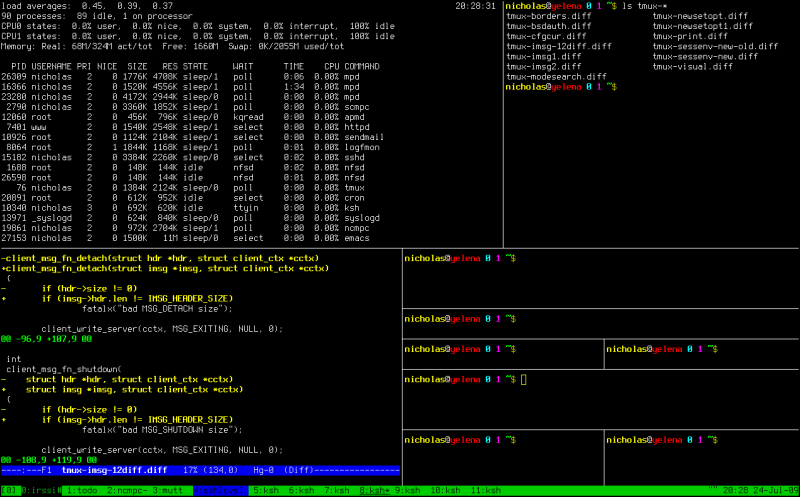 , à l’instar de Screen, est un multiplexeur de terminaux, outil permettant d’exploiter plusieurs terminaux au sein d’un seul et même affichage.
Installation
Tmux n’est pas installé par défaut. Pour l’installer à l’aide d’un utilitaire graphique il suffit d’Installer le paquets tmux.
Par l’installer avec apt-get depuis un terminal, il suffit de saisir la commande suivante :
sudo apt-get install tmux
Utilisation de tmux
Les principaux raccourcis
Tmux fait appel à l’ensemble de touches <Ctrl> <b> là ou screen fait appel à <Ctrl> <a>.
Les raccourcis et fonctions étant proches voire identiques à ceux de Screen, pour mieux les comprendre, reportez-vous à la page
Screen.
Raccourcis de base
- <Ctrl> <b> suivi de <c> : Créer un nouveau terminal dans la session tmux active
- <Ctrl> <b> suivi de <n> : Switcher entre les différents terminaux de la session
- <Ctrl> <b> suivi de <X> : Choisir un terminal spécifique (ou X est le numéro du terminal)
- <Ctrl> <b> suivi de <d> : Se détacher de la session tmux (lancer ‘tmux a’ pour s’y rattacher)
- <Ctrl> <b> suivi de <,> : Permet de renommer un terminal
- <Ctrl> <b> suivi de <w> : Affiche la liste des terminaux disponibles
- <Ctrl> <b> suivi de <t> : Afficher l’heure dans un terminal
Commandes dans un Split
- <Ctrl> <b> suivi de <« > : Split vertical du terminal courant en deux ouverture d’un terminal dans le nouveau panel
- <Ctrl> <b> suivi de <%> : Split horizontal du terminal courant en deux ouverture d’un terminal dans le nouveau panel
- <Ctrl> <b> suivi de <o> : Switcher entre les terminaux splittés
- <Ctrl> <b> suivi de <espace> : Changer l’organisation visuelle des terminaux splittés
- <Ctrl> <b> suivi de <Alt> (flèches directionnelles) : Reduire, agrandir fenêtre du split
- <Ctrl> <b> suivi de <!> : Convertir un split en terminal seul
- <Ctrl> <b> suivi de <q> : Afficher les numéros des terminaux splittés
- <Ctrl> <b> puis saisissez :join : permet de joindre un terminal seul dans un split
Par exemple, après avoir tapé le combo <Ctrl> <b> si vous saisissez
:join -v -s 3.0 -p 50
Où :
-h ou -v : pour horizontalement ou verticalement-s 3.0 : terminal 3 et volet 0 (volet si écran splitté)-p 50 : occupation à 50% de la fenêtre
Ici donc vous ajouterez verticalement, un terminal numéroté 3 et qui prendra 50% de l’espace total.
Lire la suite…
Many system administrators seem to have problems with the concepts of pipes and redirection in a shell. A coworker recently asked me how to deal with log files. How to find the information he was looking for. This article tries to shed some light on it.
Input / Output of shell commands
Many of the basic Linux/UNIX shell commands work in a similar way. Every command that you start from the shell gets three channels assigned:
- STDIN (channel 0):
Where your command draws the input from. If you don’t specify anything special this will be your keyboard input.
- STDOUT (channel 1):
Where your command’s output is sent to. If you don’t specify anything special the output is displayed in your shell.
- STDERR (channel 2):
If anything wrong happens the command will send error message here. By default the output is also displayed in your shell.
Try it yourself. The most basic command that just passes everything through from STDIN to STDOUT is the ‘cat’ command. Just open a shell and type ‘cat’ and press Enter. Nothing seems to happen. But actually ‘cat’ is waiting for input. Type something like “hello world”. Every time you press ‘Enter’ after a line ‘cat’ will output your input. So you will get an echo of everything you type. To let ‘cat’ know that you are done with the input send it an ‘end-of-file’ (EOF) signal by pressing Ctrl-D on an empty line.
The pipe(line)
A more interesting application of the STDIN/STDOUT is to chain commands together. The output of the first command becomes the input of the second command. Imagine the following chain:

The contents of the file /var/log/syslog are sent (as input) to the grep command. grep will filter the stream for lines containing the word ‘postfix’ and output that. Now the next grep picks up what was filtered and filter it further for the word ‘removed’. So now we have only lines containing both ‘postfix’ and ‘removed’. And finally these lines are sent to ‘wc -l’ which is a shell command counting the lines of some input. In my case it found 27 of such lines and printed that number to my shell. In shell syntax this reads:
cat /var/log/syslog | grep 'postfix' | grep 'removed' | wc -l
The ‘|’ character is called pipe. A sequence of such commands joined together with pipes are called pipeline.
Useless use of ‘cat’
Actually ‘cat’ is supposed to be used for concatenating files. Like “cat file1 file2”. But some administrators abuse the command to put something into a pipeline. That’s bad style and the reason why Randal L. Schwartz (a seasoned programmer) used to hand out virtual “Useless use of cat” awards. Shell commands usually can take a filename as the last argument as an input. So this would be right:
grep something /var/log/syslog | wc -l
While this works but is considered bad style:
cat /var/log/syslog | grep something | wc
Or if you knew that grep even has a “-c” option to count lines the whole task could be done with just grep:
grep -c something /var/log/syslog
Lire la suite…
Source: binarytides.com
Nmon
Nmon (Nigel’s performance Monitor for Linux) is another very useful command line utility that can display information about various system resources like cpu, memory, disk, network etc. It was developed at IBM and later released open source.
It is available for most common architectures like x86, ARM and platforms like linux, unix etc. It is interactive and the output is well organised similar to htop.
Using Nmon it is possible to view the performance of different system resources on a single screen.
The man page describes nmon as
nmon is is a systems administrator, tuner, benchmark tool. It can display the CPU, memory, network, disks (mini graphs or numbers), file systems, NFS, top processes, resources (Linux version & processors) and on Power micro-partition information.
Project website
http://nmon.sourceforge.net/
Install Nmon
Debian/Ubuntu type distros have nmon in the default repos, so grab it with apt.
$ sudo apt-get install nmon
Fedora users can get it with yum
$ sudo yum install nmon
CentOS users need to install nmon from rpmforge/repoforge repository. It is not present in Epel.
Either download the correct rpm installer from
http://pkgs.repoforge.org/nmon/
Or setup the rpmforge repository by following the instructions here
http://wiki.centos.org/AdditionalResources/Repositories/RPMForge
And then install using yum
$ sudo yum install nmon
Lire la suite…
Monitor your Linux system
 As a Linux sysadmin it feels great power when monitoring system resources like cpu, memory on the commandline. To peek inside the system is a good habit here atleast, because that’s one way of driving your Linux system safe. Plenty of tools like Htop, Nmon, Collectl, top and iotop etc help you accomplish the task. Today lets try another tool called Glances.
Glances
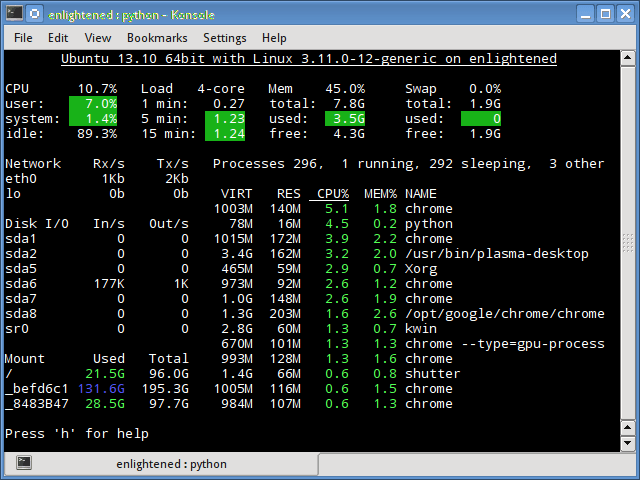
Glances is a tool similar to Nmon that has a very compact display to provide a complete overview of different system resources on just a single screen area. It does not support any complex functionality but just gives a brief overview CPU, Load, Memory, Network rate, Disk IO, file system, process number and details.
As a bonus, glances is actually cross platform, which means you can use it on obsolete OSes like windows :P.
Here’s a quick glimpse of it.
 
The output is color highlighted. Green indicates optimum levels of usage whereas red indicates that the particular resource is under heavy use.
$ glances -v
Glances version 1.6 with PsUtil 0.6.1
Project homepage https://github.com/nicolargo/glances http://nicolargo.github.io/glances/
Lire la suite…
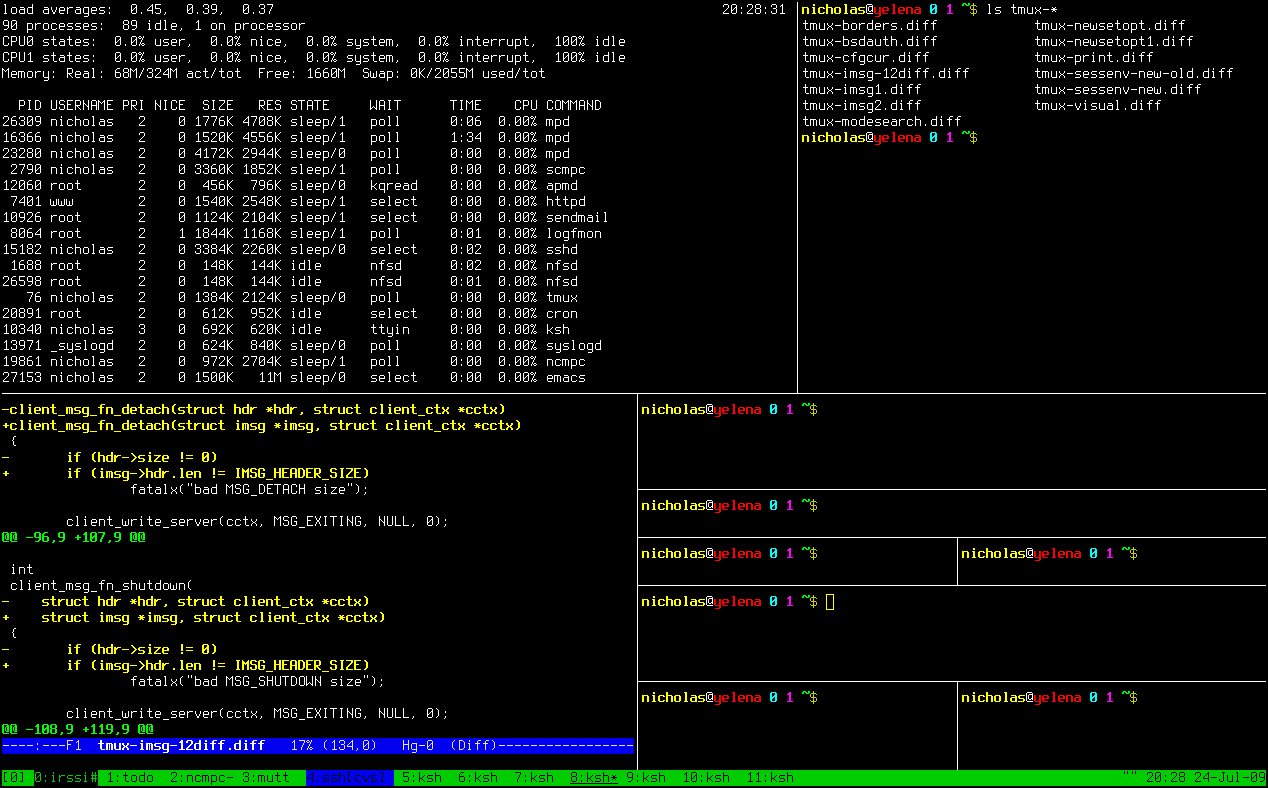 , à l’instar de Screen, est un multiplexeur de terminaux, outil permettant d’exploiter plusieurs terminaux au sein d’un seul et même affichage.
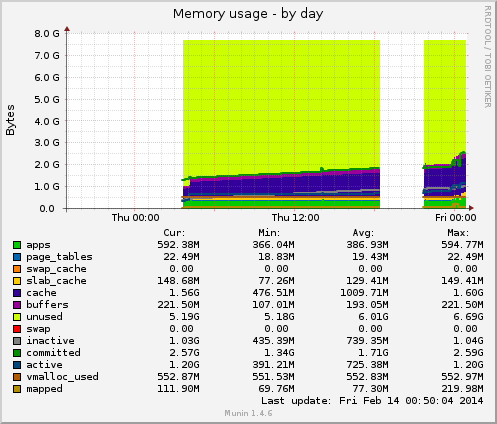 Graphs are added and removed via symlinks in the