Archive

Archives pour la catégorie ‘Logiciel’

How to analyze and view Apache web server logs interactively on Linux
01/07/2024 Comments off

analyze apache logsWhether you are in the web hosting business, or run a few web sites on a VPS yourself, chances are you want to display visitor statistics such as top visitors, requested files (dynamic or static), used bandwidth, client browsers, and referring sites, and so forth.

GoAccess is a command-line log analyzer and interactive viewer for Apache or Nginx web server. With this tool, you will not only be able to browse the data mentioned earlier, but also parse the web server logs to dig for further data as well – and all of this within a terminal window in real time. Since as of today most web servers use either a Debian derivative or a Red Hat based distribution as the underlying operating system, I will show you how to install and use GoAccess in Debian and CentOS.

Installing GoAccess on Linux

In Debian, Ubuntu and derivatives, run the following command to install GoAccess:

# aptitude install goaccess

In CentOS, you’ll need to enable the EPEL repository and then:

# yum install goaccess

In Fedora, simply use yum command:

# yum install goaccess

If you want to install GoAccess from the source to enable further options (such as GeoIP location), install required dependencies for your operating system, and then follow these steps:

# wget http://tar.goaccess.io/goaccess-0.8.5.tar.gz
# tar -xzvf goaccess-0.8.5.tar.gz
# cd goaccess-0.8.5/
# ./configure --enable-geoip
# make
# make install

That will install version 0.8.5, but you can always verify what is the latest version in the Downloads page of the project’s web site.

Since GoAccess does not require any further configurations, once it’s installed you are ready to go.

Running GoAccess

To start using GoAccess, just run it against your Apache access log.

For Debian and derivatives:

# goaccess -f /var/log/apache2/access.log

For Red Hat based distros:

# goaccess -f /var/log/httpd/access_log

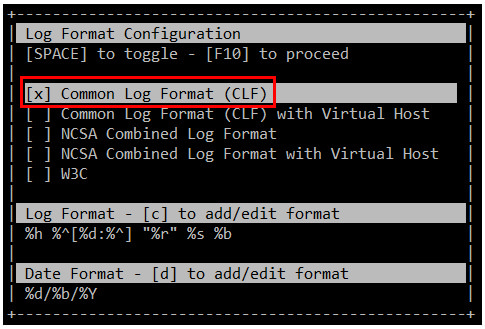
When you first launch GoAccess, you will be presented with the following screen to choose the date and log format. As explained, you can toggle between options using the spacebar and proceed with F10. As for the date and log formats, you may want to refer to the Apache documentation if you need to refresh your memory.

In this case, Choose Common Log Format (CLF):
15868350373_30c16d7c30

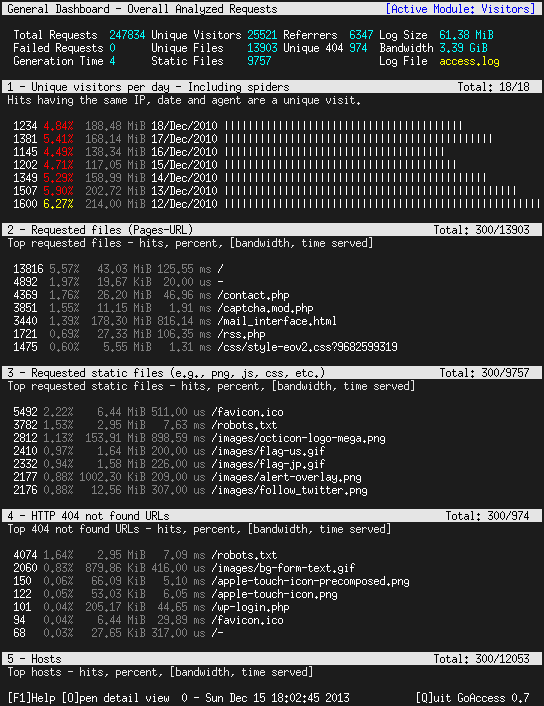
and then press F10. You will be presented with the statistics screen. For the sake of brevity, only the header, which shows the summary of the log file, is shown in the next image:

16486742901_7a35b5df69_b

Lire la suite…

4 Useful Tools to Find and Delete Duplicate Files in Linux

01/07/2024 Comments off

Organizing your home directory or even system can be particularly hard if you have the habit of downloading all kinds of stuff from the internet.

Often you may find you have downloaded the same mp3, pdf, epub (and all kind of other file extensions) and copied it to different directories. This may cause your directories to become cluttered with all kinds of useless duplicated stuff.

In this tutorial, you are going to learn how to find and delete duplicate files in Linux using rdfind and fdupes command-line tools, as well as using GUI tools called DupeGuru and FSlint.

A note of caution – always be careful what you delete on your system as this may lead to unwanted data loss. If you are using a new tool, first try it in a test directory where deleting files will not be a problem.

1. Rdfind – Finds Duplicate Files in Linux

Rdfind comes from redundant data find. It is a free tool used to find duplicate files across or within multiple directories. It uses checksum and finds duplicates based on file contains not only names.

Rdfind uses an algorithm to classify the files and detects which of the duplicates is the original file and considers the rest as duplicates. The rules of ranking are:

  • If A was found while scanning an input argument earlier than B, A is higher ranked.
  • If A was found at a depth lower than B, A is higher ranked.
  • If A was found earlier than B, A is higher ranked.

The last rule is used particularly when two files are found in the same directory.

To install rdfind in Linux, use the following command as per your Linux distribution.

$ sudo apt-get install rdfind     [On Debian/Ubuntu]
$ sudo yum install epel-release && $ sudo yum install rdfind    [On CentOS/RHEL]
$ sudo dnf install rdfind         [On Fedora 22+]
$ sudo pacman -S rdfind   [On Arch Linux]

Lire la suite…

Categories: Logiciel Tags:

What are good open-source log monitoring tools on Linux ?

26/06/2024 Comments off


In an operating system, logs are all about keeping track of events, be it critical system errors, resource usage warnings, transaction history, application status, or user activities. These logs, which are stored as (text or binary) files in the system, are useful for system auditing, debugging and maintenance. However, with so many different system entities generating log files, and even at growing rate, the challenge as a system admin is to how to « consume » these log files effectively.

That’s when log monitoring tools come into the picture, which streamline the often laborious process of collecting, parsing and analyzing log files, as well as alerting system admins for any interesting events. These tools are designed from ground up focused on log monitoring, so they offer many attractive features, such as scalable log aggregation and filtering, human-readable display, event correlation, visual or email notification, flexible log retention policy, and so on.

In this post, I am going to introduce a list of popular open-source log monitoring software for Linux, ranging from simple log file viewers to full-blown log monitoring frameworks.

Log Aggregation and Filtering

Log monitoring would not be possible without efficient and scalable mechanisms to collect and pre-process log files. Tools in this category focus on shipping, collecting, filtering, indexing and storing log files, so that they can be further analyzed and visualized in subsequent monitoring pipelines.

1. rsyslog: an open-source log collector server which can filter and consolidate log data (based on syslog protocol) from different hosts and devices in the network. rsyslog can be configured as a server or a client, where the former plays the role of a log collector and the latter runs as a log sender.

2. syslog-ng: another open-source implementation of the syslog protocol with more advanced and user-friendly features such as content-based filtering, easier-to-understand config format, and real-time event correlation.

3. systemd journal: systemd journal can be configured for remote journal logging, where locally logged events are forwarded to a remote server over HTTP. In this setup, systemd-journal-upload on a client host serializes and forwards journal messages to systemd-journal-remote running on a remote collector server.

4. logstash: an open-source tool that collects, parses, and stores log files for offline search and analysis. logstash can run in various pipelines due to many plugins supporting different input/output interfaces, decoding/encoding, and filtering rules. Input plugins allows logstash to gather log files from different sources and protocols (e.g., files, S3, RabbitMQ, syslog, collectd, TCP/UDP sockets). Filter/codec plugins are used to parse, convert, modify and add metadata to log files. Output plugins pass processed log files to various target storages (e.g., file, Google cloud storage, Nagios, S3, Zabbix).

5. collectd: a daemon service which gathers various system-level statistics, and stores them for historical analysis or real-time graphing. Similar to logstash, collectd is an extensible architecture, where you can enable various input/output plugins to change its collection behaviors. For log collection, collectd can leverage LogFile and Network plugins to aggregate remote log files.

6. Logster: an open-source utility for parsing log files for any interesting data, and aggregating extracted data into metrics for subsequent reporting and graphing pipelines.

7. Fluentd: a unified log aggregation layer which allows in-stream processing for a variety of streaming data and log files. It comes with a huge plugin ecosystem with more than 300 plugins to support various input sources and output interfaces.

8. Nxlog: a unified log collector and forwarder which supports a variety of log sources, formats and protocols. Advanced features include multi-threaded log collection and processing, message buffering and prioritization, built-in log rotation, and TLS/SSL transport.

9. Scribe:: a scalable log collector server developed by Facebook. Scribe can aggregate log data which is streamed in real time from a large number of clients. It uses Apache Thrift for protocol encoding, so its interface is compatible with pretty much any languages. While a proven solution, Scribe is not something you can deploy quickly as a turnkey. Also, note that Scribe is no longer updated and maintained.

10. Flume: a highly scalable and reliable service to transport and collect large volumes of streaming log data from any clients, and store them in backend storage such as Apache Hadoops’ HDFS.

Lire la suite…

How To Configure Redis Caching to Speed Up WordPress on Ubuntu 14.04

15/06/2024 Comments off

Introduction

redisRedis is an open-source key value store that can operate as both an in-memory store and as cache. Redis is a data structure server that can be used as a database server on its own, or paired with a relational database like MySQL to speed things up, as we’re doing in this tutorial.

For this tutorial, Redis will be configured as a cache for WordPress to alleviate the redundant and time-consuming database queries used to render a WordPress page. The result is a WordPress site which is much faster, uses less database resources, and provides a tunable persistent cache. This guide applies to Ubuntu 14.04.

While every site is different, below is an example benchmark of a default WordPress installation home page with and without Redis, as configured from this guide. Chrome developer tools were used to test with browser caching disabled.

Default WordPress home page without Redis:

804ms page load time

Default WordPress home page with Redis:

449ms page load time

Note: This implementation of Redis caching for WordPress relies on a well-commented but third-party script. The script is hosted on DigitalOcean’s asset server, but was developed externally. If you would like to make your own implementation of Redis caching for WordPress, you will need to do some more work based on the concepts presented here.

Redis vs. Memcached

Memcached is also a popular cache choice. However, at this point, Redis does everything Memcached can do, with a much larger feature set. This Stack Overflow page has some general information as an overview or introduction to persons new to Redis.

How does the caching work?

The first time a WordPress page is loaded, a database query is performed on the server. Redis remembers, or caches, this query. So, when another user loads the WordPress page, the results are provided from Redis and from memory without needing to query the database.

The Redis implementation used in this guide works as a persistent object cache for WordPress (no expiration). An object cache works by caching the SQL queries in memory which are needed to load a WordPress page.

When a page loads, the resulting SQL query results are provided from memory by Redis, so the query does not have to hit the database. The result is much faster page load times, and less server impact on database resources. If a query is not available in Redis, the database provides the result and Redis adds the result to its cache.

If a value is updated in the database (for example, a new post or page is created in WordPress) the Redis value for that query is invalidated to prevent bad cached data from being presented.

If you run into problems with caching, the Redis cache can be purged by using the flushall command from the Redis command line:

redis-cli

Once you see the prompt, type:

flushall

Additional Reference: WordPress Object Cache Documentation

Prerequisites

Before starting this guide, you’ll need to set up a sudo user and install WordPress.

  • Ubuntu 14.04 Droplet (1 GB or higher recommended)
  • Add a sudo user
  • Install WordPress. This guide has been tested with these instructions, although there are many ways to install WordPress

Lire la suite…

Categories: Logiciel Tags: ,

How To Turn Off Post Revision In WordPress 2.6

09/06/2024 Comments off

One of the irritating feature for me in WordPress 2.6 is the post revision. I am the only author of my blog and hence this feature is useless to me.

Just in case you are wondering how post revision works, whenever a post is edited, a new row will be created in wp_posts table. Hence if your posts or pages got edited 10 times, you will have 10 new rows in wp_posts table.

In no time your wp_posts table will be filled up and the post ID will be huge.

To turn off this feature, add this following code to wp-config.php:

define('WP_POST_REVISIONS', false);

You can also delete all post revisions by running this query in phpMyAdmin:

DELETE a,b,c  
FROM wp_posts a  
LEFT JOIN wp_term_relationships b ON (a.ID = b.object_id)  
LEFT JOIN wp_postmeta c ON (a.ID = c.post_id)  
WHERE a.post_type = 'revision'  

Be sure to backup your database first before performing any queries in phpMyAdmin.

*UPDATE* Auto Saves does not create a revision of the post.

*UPDATE 2* Updated SQL query from Andrei Neculau as the previous query does not delete from wp_postmeta and wp_term_relationships tables.

*UPDATE 3* There is a proper way of cleaning up Post Revisions as mentioned by kitchin in Deleting Post Revisions: do NOT use the a,b,c JOIN code you see everywhere. I like his method more than the SQL query above.

Source: Lester Chan’s WordPress Plugins

Categories: Logiciel Tags: